the Creative Commons Attribution 4.0 License.

Special issue: Atmospheric deposition in the low-nutrient-low-chlorophyll...
the Creative Commons Attribution 4.0 License.
Research article 06 Oct 2021
Research article | 06 Oct 2021
Impact of dust addition on the metabolism of Mediterranean plankton communities and carbon export under present and future conditions of pH and temperature
- 1Sorbonne Université, CNRS, Laboratoire d'Océanographie de Villefranche, LOV, 06230 Villefranche-sur-Mer, France
- 2Aix-Marseille Université, Université de Toulon, CNRS/INSU, IRD, Mediterranean Institute of Oceanography (MIO), UM 110, 13288, Marseille, France
- 3Department of Ecology and Animal Biology, Universidade de Vigo, 36310 Vigo, Spain
- 4Sorbonne Université, CNRS, Institut de la Mer de Villefranche, IMEV, 06230 Villefranche-sur-Mer, France
- 5The Marine Biological Association of the UK, PL1 2PB Plymouth, United Kingdom
- 6GEOMAR Helmholtz Centre for Ocean Research, Kiel, Germany
- 7CNRS, Sorbonne Université, Laboratoire d'Océanographie Microbienne, LOMIC, 66650 Banyuls-sur-Mer, France
- 8Scripps Institution of Oceanography, University of California San Diego, La Jolla, CA 92037, USA
Correspondence: Frédéric Gazeau (frederic.gazeau@imev-mer.fr)
Hide author detailsCorrespondence: Frédéric Gazeau (frederic.gazeau@imev-mer.fr)
Although atmospheric dust fluxes from arid as well as human-impacted areas represent a significant source of nutrients to surface waters of the Mediterranean Sea, studies focusing on the evolution of the metabolic balance of the plankton community following a dust deposition event are scarce, and none were conducted in the context of projected future levels of temperature and pH. Moreover, most of the experiments took place in coastal areas. In the framework of the PEACETIME project, three dust-addition perturbation experiments were conducted in 300 L tanks filled with surface seawater collected in the Tyrrhenian Sea (TYR), Ionian Sea (ION) and Algerian basin (FAST) on board the R/V Pourquoi Pas? in late spring 2017. For each experiment, six tanks were used to follow the evolution of chemical and biological stocks, biological activity and particle export. The impacts of a dust deposition event simulated at their surface were followed under present environmental conditions and under a realistic climate change scenario for 2100 (ca. +3 ∘C and −0.3 pH units). The tested waters were all typical of stratified oligotrophic conditions encountered in the open Mediterranean Sea at this period of the year, with low rates of primary production and a metabolic balance towards net heterotrophy. The release of nutrients after dust seeding had very contrasting impacts on the metabolism of the communities, depending on the station investigated. At TYR, the release of new nutrients was followed by a negative impact on both particulate and dissolved 14C-based production rates, while heterotrophic bacterial production strongly increased, driving the community to an even more heterotrophic state. At ION and FAST, the efficiency of organic matter export due to mineral/organic aggregation processes was lower than at TYR and likely related to a lower quantity/age of dissolved organic matter present at the time of the seeding and a smaller production of DOM following dust addition. This was also reflected by lower initial concentrations in transparent exopolymer particles (TEPs) and a lower increase in TEP concentrations following the dust addition, as compared to TYR. At ION and FAST, both the autotrophic and heterotrophic community benefited from dust addition, with a stronger relative increase in autotrophic processes observed at FAST. Our study showed that the potential positive impact of dust deposition on primary production depends on the initial composition and metabolic state of the investigated community. This impact is constrained by the quantity of nutrients added in order to sustain both the fast response of heterotrophic prokaryotes and the delayed one of primary producers. Finally, under future environmental conditions, heterotrophic metabolism was overall more impacted than primary production, with the consequence that all integrated net community production rates decreased with no detectable impact on carbon export, therefore reducing the capacity of surface waters to sequester anthropogenic CO2.
- Article
(3688 KB) - Companion paper
-
Supplement
(2390 KB) - BibTeX
- EndNote


Low-nutrient low-chlorophyll (LNLC) areas represent 60 % of the global ocean surface area (Longhurst et al., 1995; McClain et al., 2004). Although phytoplankton production in these areas is limited by the availability of nitrogen, phosphorus and iron, it accounts for 50 % of global carbon export (Emerson et al., 1997; Roshan and DeVries, 2017). Atmospheric dust fluxes represent a significant source of these nutrients to surface waters in LNLC regions and as such could play a significant role in stimulating primary production (e.g., Bishop et al., 2002; Guieu et al., 2014a; Jickells and Moore, 2015), potentially increasing the efficiency of the biological pump in the sequestration of atmospheric CO2. However, as heterotrophic prokaryotes have been shown to outcompete phytoplankton during nutrient addition experiments (e.g., Guieu et al., 2014b; Mills et al., 2008; Thingstad et al., 2005), dust deposition could induce even stronger enhancements of heterotrophic bacterial production and/or respiration rates, thereby reducing net atmospheric CO2 drawdown and the potential for carbon export outside the euphotic zone (Guieu et al., 2014a). Indeed, several experiments conducted in the Atlantic Ocean and in the Mediterranean Sea have shown a fast and dominant effect of dust additions on heterotrophic bacterioplankton metabolism (Herut et al., 2005, 2016; Lekunberri et al., 2010; Marañón et al., 2010; Pulido-Villena et al., 2008, 2014). However, to the best of our knowledge, no study focused on the evolution of the metabolic balance of the plankton community after such a dust event in the open sea. The metabolic balance (or net community production, NCP) is defined as the difference between gross primary production (GPP) of autotrophic organisms and community respiration (CR) of both autotrophic and heterotrophic organisms, revealing the capacity of surface waters to absorb atmospheric CO2.
The Mediterranean Sea is a perfect example of LNLC regions and receives anthropogenic aerosols originating from industrial and domestic activities from all around the basin and other parts of Europe and pulses of natural inputs from the Sahara (Desboeufs, 2021). These atmospheric depositions, mostly in the form of pulsed inputs (Loÿe-Pilot and Martin, 1996), provide new nutrients (Guieu et al., 2010; Kouvarakis et al., 2001; Markaki et al., 2003; Ridame and Guieu, 2002) to the surface waters with fluxes that are of the same order of magnitude as riverine inputs (Powley et al., 2017). These significant nutrient enrichments likely support primary production especially during the stratification period (Bonnet et al., 2005; Ridame and Guieu, 2002). However, no clear correlation between dust and ocean color have been evidenced from long series of satellite observations (Guieu and Ridame, 2020). This raises the question of which compartment (autotrophic or heterotrophic) benefits the most from this transient relief in nutrient (N, P) limitation.
In response to ocean warming and increased stratification, LNLC areas are expected to expand in the future (Irwin and Oliver, 2009; Polovina et al., 2008) due to lower nutrient supply from sub-surface waters (Behrenfeld et al., 2006). Furthermore, dust deposition could increase in the future due to desertification (Moulin and Chiapello, 2006), although so far the trend for deposition remains uncertain because the drying of the Mediterranean basin might also induce less wet deposition over the basin (Laurent et al., 2021). Nevertheless, whether the fluxes increase or not in the coming decades and centuries, new nutrients from atmospheric sources will play an important role in a surface mixed layer even more stratified and isolated from the deeper nutrient-rich layer. The question remains of how plankton metabolism and carbon export would respond in a warmer and more acidified ocean. Indeed, with an average annual anthropogenic CO2 uptake, during the period 2010 to 2019, of 2.5±0.6 Gt C (∼22.9 % of anthropogenic emissions; Friedlingstein et al., 2020), the oceans substantially contribute towards slowing down the increase in atmospheric CO2 concentrations, and therefore towards limiting terrestrial and ocean warming. However, this massive CO2 input induces global changes in seawater chemistry referred to as “ocean acidification” because increased CO2 concentration lowers seawater pH (i.e., increases its acidity).
Although the response of plankton metabolism to ocean warming has been shown to be highly dependent on resource availability (Lewandowska et al., 2014), both for heterotrophic bacteria (Lopez-Urrutia and Moran, 2007) and phytoplankton (Marañón et al., 2018), it has been suggested that ocean warming will substantially weaken the ocean biological CO2 sink in the future as a consequence of stronger increases in remineralization than in photosynthesis processes, following the metabolic theory of ecology (MTE; Brown et al., 2004; Gillooly et al., 2001). Ocean acidification alone has been shown to exert no or very limited influence on plankton metabolism in the Mediterranean Sea (Maugendre et al., 2017a; Mercado et al., 2014). To the best of our knowledge, only Maugendre et al. (2015) studied the combined impact of ocean warming and acidification on plankton metabolism in the Mediterranean Sea. They found a very limited impact of ocean acidification on the plankton community and a positive impact of warming on small phytoplankton species (e.g., Cyanobacteria) with a potential decrease in the export and energy transfer to higher trophic levels. Their study was conducted under nutrient-depleted conditions (Maugendre et al., 2017b). Hence, there is still a need to assess the combined impact of warming and acidification on the metabolic balance of plankton communities in this region, following a transient relief in nutrient availability.
So far there has been no attempt to evaluate the evolution of plankton metabolism and carbon export following atmospheric deposition in the context of future levels of temperature and pH. Such experiments were conducted in the frame of the PEACETIME project (ProcEss studies at the Air-sEa Interface after dust deposition in the MEditerranean Sea; http://peacetime-project.org/, last access: 4 October 2021) during the cruise on board the R/V Pourquoi Pas? in May–June 2017 (Guieu et al., 2020a, b). The project aimed at extensively studying and parameterizing the chain of processes occurring in the Mediterranean Sea after atmospheric deposition, especially of Saharan dust, and to put them in perspective of ongoing environmental changes. During this cruise, three perturbation experiments were conducted in 300 L tanks filled with surface seawater collected in the Tyrrhenian Sea (TYR), Ionian Sea (ION) and Algerian basin (FAST; Fig. 1). Six tanks were used to follow the evolution of chemical and biological stocks, biological activity, and export, following a wet dust deposition event simulated at their surface, both under present environmental conditions and following a realistic climate change scenario for 2100 (ca. +3 ∘C and −0.3 pH units; IPCC, 2013). A companion paper presents the general setup of the experiments and the impacts of dust under present and future environmental conditions on nutrients and biological stocks (Gazeau et al., 2021). In this paper, we show that the effects of dust deposition on biological stocks were highly different between the three investigated stations and could not be attributed to differences in their degree of oligotrophy but rather to the initial metabolic state of the community. We further demonstrated that ocean acidification and warming did not drastically modify the composition of the autotrophic assemblage, with all groups positively impacted by warming and acidification. Here, we focus on the impacts of dust seeding on plankton metabolism (e.g., primary production, heterotrophic prokaryote production) and carbon export.
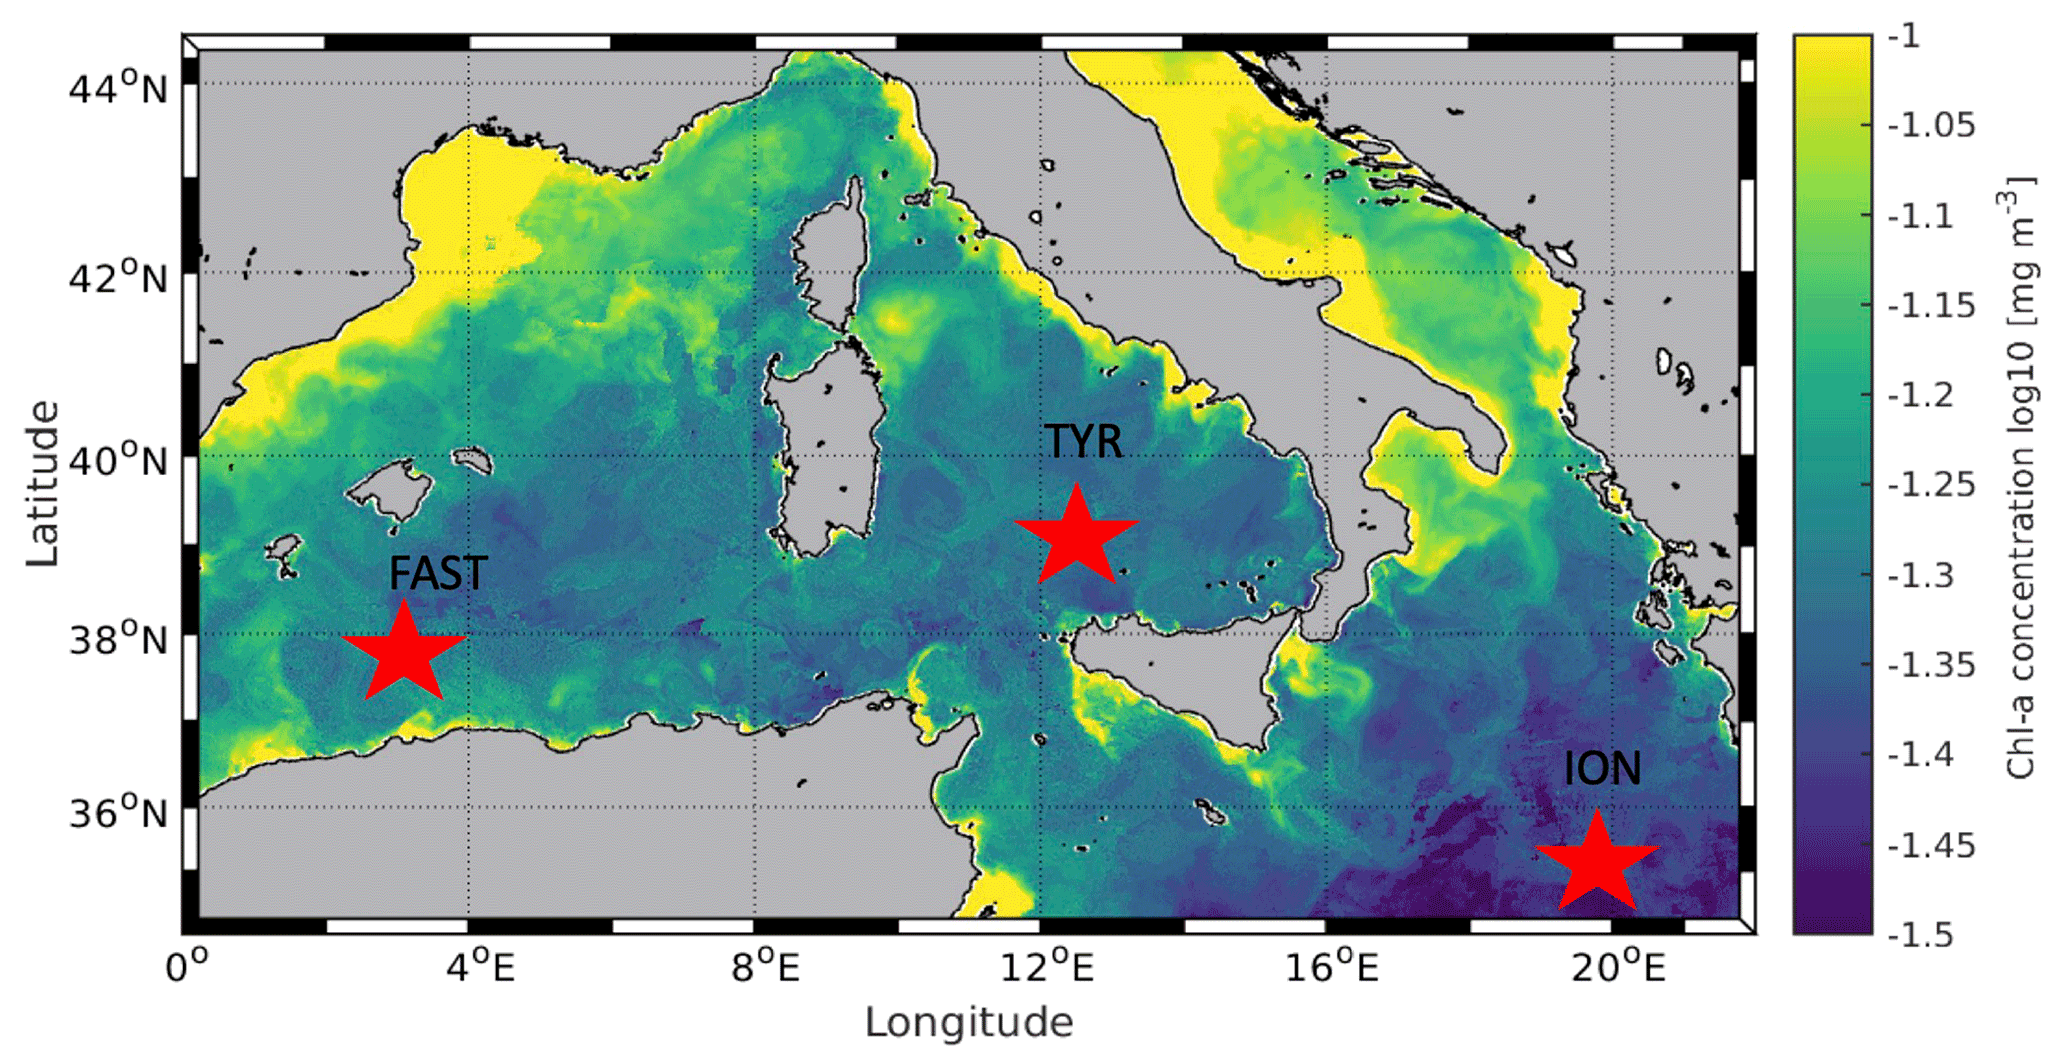
Figure 1Location of the sampling stations in the Mediterranean Sea on board the R/V Pourquoi Pas? during the PEACETIME cruise (10 May to 11 June 2017). Background shows satellite-derived surface chlorophyll a concentration averaged over the entire duration of the cruise (courtesy of Louise Rousselet).
2.1 General setup
The general setup of the experiments is fully detailed in Gazeau et al. (2021). Briefly, three experiments were performed at the long-duration stations TYR, ION and FAST during the PEACETIME cruise on board R/V Pourquoi Pas? (Fig. 1). During these experiments (3 to 4 d each), seawater was incubated in 300 L tanks (Fig. S1 in the Supplement) installed in a temperature-controlled container, in which the irradiance spectrum and intensity can be finely controlled and in which future ocean acidification and warming conditions can be fully reproduced. The tanks were made of high-density polyethylene (HDPE) and were trace-metal-free in order to avoid contaminations, with a height of 1.09 m, a diameter of 0.68 m, a surface area of 0.36 m2 and a volume of 0.28 m3. The conical base of the tanks was equipped with a sediment trap that was left open during the duration of the experiments and removed at the end. The experimental protocol comprised two unmodified control tanks (C1 and C2), two tanks enriched with Saharan dust (D1 and D2), and two tanks enriched with Saharan dust and maintained simultaneously under warmer (+3 ∘C) and acidified (−0.3 pH unit) conditions (G1 and G2). At the three stations, tanks were always filled at the end of the day before the start of the experiments: TYR (17 May 2017), ION (25 May 2017) and FAST (2 June 2017). The tanks were filled by means of a large peristaltic pump (Verder© VF40 with EPDM hose, flow of 1200 L h−1) collecting seawater below the base of the boat (depth of ∼5 m), used to continuously supply surface seawater to a series of instruments during the entire campaign. While filling the tanks, seawater was sampled for the measurements of selected parameters (sampling h). After filling the tanks, seawater was slowly warmed overnight using 500 W heaters, controlled by temperature-regulation units (COREMA©), in G1 and G2 to reach an offset of +3 ∘C. 13C bicarbonate was added to all tanks at 04:00 LT (all times in local time), and G1 and G2 were acidified by addition of CO2-saturated filtered (0.2 µm) seawater (∼1.5 L in 300 L; collected when filling the tanks at each station) at 04:30 LT to reach a pH offset of −0.3. Sampling for many parameters took place prior to dust seeding (sampling time=t0). Dust seeding was performed between 07:00 and 09:00 LT in tanks D1, D2, G1 and G2. The same dust analog was used and the same dust flux was simulated as for the DUNE 2009 experiments described in Desboeufs et al. (2014). Briefly, the fine fraction (<20 µm) of Saharan soils collected in southern Tunisia, which is a major source of dust deposition over the northwestern Mediterranean basin, was used in the seeding experiments. The particle size distribution showed that 99 % of particles had a size smaller than 0.1 µm, and that particles were mostly made of quartz (40 %), calcite (30 %) and clay (25 %; Desboeufs et al., 2014). This collected dust underwent an artificial chemical aging process by addition of nitric and sulfuric acid (HNO3 and H2SO4, respectively) to mimic cloud processes during atmospheric transport of aerosol with anthropogenic acid gases (Guieu et al., 2010, and references therein). To mimic a wet flux event of 10 g m−2, 3.6 g of this analog dust was quickly diluted into 2 L of ultrahigh-purity water (UHP water; 18.2 MΩ cm−1 resistivity) and sprayed at the surface of the tanks using an all-plastic garden sprayer (duration=30 min). The intensity of this simulated wet deposition event (i.e., 10 g m−2) represents a high but realistic scenario, as several studies reported even higher short wet deposition events in this area of the Mediterranean Sea (Bonnet and Guieu, 2006; Loÿe-Pilot and Martin, 1996; Ternon et al., 2010).
Depending on the considered parameter or process, seawater sampling was conducted 1 (t1 h), 6 (t6 h), 12 (t12 h), 24 (t24 h), 48 (t48 h) and 72 h (t72 h) after dust additions in all three experiments with an additional sample after 96 h (t96 h) at FAST). Acid-washed silicone tubes were used for transferring the water collected from the tanks to the different vials or containers.
2.2 Stocks
2.2.1 Dissolved and particulate organic carbon
The concentration of dissolved organic carbon (DOC) was determined from duplicate 10 mL GF/F (pre-combusted, Whatman©) filtered subsamples that were transferred to pre-combusted glass ampoules, acidified with H3PO4 (final pH=2) and sealed. The sealed glass ampoules were stored in the dark at room temperature until analysis at the Laboratoire d'Océanographie Microbienne (LOMIC). DOC measurements were performed on a Shimadzu© TOC-V-CSH (Benner and Strom, 1993). Prior to injection, DOC samples were sparged with CO2-free air for 6 min to remove inorganic carbon. Sample (100 µL) were injected in triplicate, and the analytical precision was 2 %. Standards were prepared with acetanilid.
Seawater samples for measurements of particulate organic carbon concentrations (POC; 2 L) were taken at t−12 h, t0, t12 h, t24 h, t48 h and t72 h (or t96 h for station FAST), filtered on pre-combusted GF/F membranes, dried at 60 ∘C and analyzed at the Laboratoire d'Océanographie de Villefranche (LOV, France) following decarbonatation with a drop of HCl 2N, on an elemental analyzer coupled with an isotope ratio mass spectrometer (EA-IRMS; Vario Pyrocube-Isoprime 100, Elementar©). A caffeine standard (IAEA-600) was used to calibrate the EA-IRMS.
2.2.2 Total hydrolysable carbohydrates and amino acids
For total hydrolysable carbohydrates and amino acids, samples were taken at t0, t6 h, t24 h, t48 h and t72 h at all stations. For total hydrolysable carbohydrates (TCHO) >1 kDa, samples (20 mL) were filled into pre-combusted glass vials (8 h, 500 ∘C) and stored at −20 ∘C pending analysis. Prior to analysis, samples were desalted with membrane dialysis (1 kDa MWCO, Spectra Por) at 1 ∘C for 5 h. Samples were subsequently hydrolyzed for 20 h at 100 ∘C with 0.8 M HCl final concentration followed by neutralization using acid evaporation (N2, for 5 h at 50 ∘C). TCHO were analyzed at GEOMAR using high-performance anion exchange chromatography with pulsed amperometric detection (HPAEC-PAD), on a Dionex© ICS 3000 ion chromatography system following the procedure of Engel and Händel (2011). Two replicates per TCHO sample were analyzed. The variation coefficient between duplicate measurements was 7 % on average.
For total hydrolysable amino acids (TAAs), samples (5 mL) were filled into pre-combusted glass vials (8 h, 500 ∘C) and stored at −20 ∘C. Samples were hydrolyzed at 100 ∘C for 20 h with 1 mL 30 % HCl (Suprapur®, Merck), added to 1 mL of sample, and neutralized by acid evaporation in a vacuum at 60 ∘C in a microwave. Samples were analyzed by high-performance liquid chromatography (HPLC) using an Agilent 1260 HPLC system following a modified version of established methods (Dittmar et al., 2009; Lindroth and Mopper, 1979). Separation of 13 amino acids with a C18 column (Phenomenex Kinetex, 2.6 µm, 150×4.6 mm) was obtained after in-line derivatization with o-phthaldialdehyde and mercaptoethanol. A gradient with solvent A containing 5 % acetonitrile (LiChrosolv, Merck, HPLC gradient grade) in sodium dihydrogen phosphate (Suprapur®, Merck) buffer (pH 7.0) and solvent B being acetonitrile was used for analysis. A gradient from 100 % solvent A to 78 % solvent A was produced in 50 min. Two replicates per TAA sample were analyzed. The variation coefficient between duplicate measurements was 8 % on average. For TCHO and TAA, instrument blanks were performed with Milli-Q water. The detection limit was calculated as 3× the blank value, which is ∼1 nmol L−1 for both parameters.
2.2.3 Transparent exopolymer particles
Samples for transparent exopolymer particles (TEPs) were taken at t0, t24 h and t72 h at all stations. The abundance and area of TEPs were microscopically measured following the procedure given in Engel (2009). Samples of 10–50 mL were directly filtered in a low vacuum (<200 mbar) onto a 0.4 µm Nucleopore membrane (Whatman©) filter, stained with 1 mL Alcian Blue solution (0.2 g L−1 w/v) for 3 s and rinsed with Milli-Q water. Filters were mounted on Cytoclear© slides and stored at −20 ∘C until analysis. Two filters per sample with 30 images each were analyzed using a Zeiss Axio Scope.A1 (Zeiss©) and an AxioCam MRc (Zeiss©). The pictures with a resolution of 1388×1040 pixels were saved using AxioVision LE64 Rel. 4.8 (Zeiss©). All particles larger than 0.2 µm2 were analyzed. ImageJ© and R were subsequently used for image analysis (Schneider et al., 2012). The coefficients of variation between duplicate filters averaged 28 %.
Filters prepared with 10 mL Milli-Q water instead of samples served as a blank. Blanks were always <1 % of sample values. The carbon content of TEP (TEP-C) was estimated after Mari (1999) using the following size-dependent relationship:
with ni being the number of TEPs in the size class i and ri being the mean equivalent spherical radius of the size class. The constant (µg C) and the fractal dimension of aggregates D=2.55 were used as proposed by Mari (1999). To relate to organic carbon concentration in seawater, data for TEP-C are given in µmol L−1.
2.3 Processes
2.3.1 Dissolved and particulate 14C incorporation rates
The photosynthetic production of particulate (<0.2–2 µm and >2 µm size fractions) and dissolved organic matter was determined from samples taken at t0, t24 h, t48 h and t72 h (or t96 h at station FAST) with the 14C-uptake technique. From each tank, four polystyrene bottles (70 mL; three light and one dark) were filled with sampled seawater and amended with 40 µCi of NaH14CO3. Bottles were incubated for 8 h in two extra 300 L tanks maintained under similar light and temperature regimes to those in the experimental tanks (ambient temperature for C1, C2, D1 and D2 and ambient temperature +3 ∘C for G1 and G2). Incubations were terminated by sequential filtration of the sample through polycarbonate filters (pore sizes 2 and 0.2 µm, 47 mm diameter) using a low-pressure vacuum. Filters were exposed for 12 h to concentrated HCl fumes to remove non-fixed, inorganic 14C and then transferred to 4 mL plastic scintillation vials to which 3.5 mL of scintillation cocktail (Ultima Gold XR, Perkin Elmer©) was added. For the measurement of dissolved primary production, a 5 mL aliquot of each sampling bottle was filtered, at the end of incubation, through a 0.2 µm polycarbonate filter (25 mm diameter). This filtration was conducted, in a low-pressure vacuum, in a circular filtration manifold that allows the recovery of the filtrate into 20 mL scintillation vials. The filtrates were acidified with 200 µL of 50 % HCl and maintained in an orbital shaker for 12 h. Finally, 15 mL of liquid scintillation cocktail was added to each sample. All filter and filtrate samples were measured on board in a liquid scintillation counter (Packard© 1600 TR). 14C-based production rates (PP; in ) were calculated as follows:
where CT is the concentration of total dissolved inorganic carbon (µg C L−1), DPMsample and DPMdark are the radioactivity counts in the light and dark bottle, respectively, DPMadded is the radioactivity added to each sample, and t is the incubation time (h).
The percentage extracellular release (PER%) was calculated as follows:
where PPd refers to 14C-based dissolved production and PPp refers to 14C-based particulate production (sum of <2 and >2 µm size fractions).
2.3.2 Integrated 13C incorporation
Addition of 13C bicarbonate (NaH13CO3 99 %; Sigma-Aldrich©) was performed in each tank before t0 in order to increase the isotopic level (δ13C signature) of the dissolved inorganic carbon pool to ca. 350 ‰. We followed the time evolution of the δ13C signature in dissolved inorganic carbon (δ13C CT), dissolved organic carbon (δ13C DOC) and particulate organic carbon pools (δ13C POC). For the analysis of the actual δ13C CT, 60 mL of sampled seawater (at t−12 h, t0, t12 h, t24 h, t48 h and t72 h; +t96 h at station FAST) was gently transferred to glass vials, avoiding bubbles. Vials were sealed after being poisoned with 12 µL saturated HgCl2 and stored upside-down at room temperature in the dark pending analysis. At the University of Leuven, a helium headspace (5 mL) was created in the vials and samples were acidified with 2 mL of phosphoric acid (H3PO4, 99 %). Samples were left to equilibrate overnight to transfer all CT to gaseous CO2. Samples were injected in the carrier gas stream of an EA-IRMS (Thermo© EA1110 and Delta V Advantage), and data were calibrated with NBS-19 and LSVEC standards (Gillikin and Bouillon, 2007).
At the same frequency as for δ13C CT, samples for δ13C DOC were filtered online (see above), transferred to 40 mL pre-cleaned borosilicate amber EPA vials with septa caps (PTFE-lined silicone) and stored in the dark pending analysis at the Ján Veizer Stable Isotope Laboratory (Ottawa, Canada).
At t−12 h, t0, t12 h, t24 h, t48 h and t72 h (or t96 h at station FAST), the δ13C POC was obtained based on the same measurements as described above for POC, on an elemental analyzer coupled with an isotope ratio mass spectrometer (EA-IRMS; Vario Pyrocube-Isoprime 100, Elementar©).
Carbon isotope data are expressed in the delta notation (δ) relative to the Vienna Pee Dee Belemnite (VPDB) standard (Schimmelmann et al., 2016). The carbon isotope ratio was calculated as follows:
with RVPDB=0.011237.
2.3.3 Community metabolism (oxygen light–dark method)
At the same frequency as for 14C incorporation, from each tank, a volume of 2 L was sampled in plastic bottles and distributed in 15 biological oxygen demand (BOD; 60 mL) borosilicate bottles. Five BOD bottles were immediately fixed with Winkler reagents (initial O2 concentrations) and were incubated in the dark for the measurement of community respiration (CR) in two incubators maintained respectively at ambient temperature for C1, C2, D1 and D2 and at ambient temperature +3 ∘C for G1 and G2. Additionally, five BOD bottles were incubated for the measurement of net community production (NCP) in the same tanks as described above for 14C incorporation. Upon completion of the incubations (24 h), samples were fixed with Winkler reagents. Within one day, O2 concentrations were measured using an automated Winkler titration technique with potentiometric endpoint detection. Analyses were performed on board with a Metrohm© Titrando 888 and a redox electrode (Metrohm© Au electrode). Reagents and standardizations were similar to those described by Knap et al. (1996). NCP and CR were estimated by regressing O2 values against time, and CR was expressed as negative values. Since CR is estimated from the oxygen evolution (consumption) in bottles (negative sign), GPP corresponds to and was calculated as .
Gross primary production (GPP) was calculated as the difference between NCP and CR. The combined standard errors were calculated as follows:
2.3.4 Heterotrophic prokaryotic production and ectoenzymatic activities
At all sampling times, heterotrophic bacterial production (BP, sensus stricto referring to heterotrophic prokaryotic production) was determined on board using the microcentrifuge method with the 3H-leucine (3H-Leu) incorporation technique to measure protein production (Smith and Azam, 1992). The detailed protocol is in Van Wambeke et al. (2021). Briefly, triplicate 1.5 mL samples and one blank were incubated in the dark for 1–2 h in two thermostated incubators maintained respectively at ambient temperature for C1, C2, D1 and D2 and at ambient temperature +3 ∘C for G1 and G2. Incubations were ended by the addition of TCA to a final concentration of 5 %, followed by three runs of centrifugation at 16 000 g for 10 min. Pellets were rinsed with TCA 5 % and ethanol 80 %. A factor of 1.5 kg C mol per leucine was used to convert the incorporation of leucine to carbon equivalents, assuming no isotopic dilution (Kirchman et al., 1993).
Ectoenzymatic activities were measured fluorometrically, using fluorogenic model substrates that were L-leucine-7-amido-4-methyl-coumarin (Leu-MCA) and 4-methylumbelliferyl-phosphate (MUF-P) to track aminopeptidase activity (LAP) and alkaline phosphatase activity (AP), respectively (Hoppe, 1983). Stock solutions (5 mM) were prepared in methylcellosolve and stored at −20 ∘C. Release of the products of LAP and AP activities, MCA and MUF, was followed by measuring the increase in fluorescence (exc/em 380/440 nm for MCA and 365/450 nm for MUF, wavelength width 5 nm) in a VARIOSCAN LUXmicroplate reader calibrated with standards of MCA and MUF solutions. For measurements, 2 mL of unfiltered samples from the tanks was supplemented with 100 µL of a fluorogenic substrate solution diluted so that different concentrations were dispatched in a black 24-well polystyrene plate in duplicate (0.025, 0.05, 0.1, 0.25, 0.5, 1 µM for MUF-P; 0.5, 1, 5, 10, 25 µM for MCA-leu). Incubations were carried out in the same thermostatically controlled incubators than those used for BP and reproducing temperature levels in the experimental tanks. Incubations lasted up to 12 h with a reading of fluorescence every 1 to 2 h, depending on the intended activities. The rate was calculated from the linear part of the fluorescence-versus-time relationship. Boiled-water blanks were run to check for abiotic activity. From varying velocities obtained, we determined the parameters Vm (maximum hydrolysis velocity) and Km (Michaelis–Menten constant which reflects enzyme affinity for the substrate) by fitting the data using a non-linear regression on the following equation:
where V is the hydrolysis rate and S is the fluorogenic substrate concentration added.
2.3.5 Inorganic and organic material export
At the end of each experiment (t72 h for TYR and ION and t96 h for FAST, after artificial dust seeding), the sediment traps were removed, closed and stored in 4 % formaldehyde. Back in the laboratory, after the swimmers were removed, the samples were rinsed by centrifugation in Milli-Q water (3 times) to remove sea salt and then freeze-dried. The total amount of material collected was first weighted to measure the total exported flux. Several aliquots were then weighted to measure the following components: total carbon and organic carbon, lithogenic and biogenic silicates, and calcium. Total carbon was measured on an elemental analyzer coupled with an isotope ratio mass spectrometer (EA-IRMS; Vario Pyrocube-Isoprime 100, Elementar©). Particulate organic carbon (POC) was measured in the same way after removing inorganic carbon by acidification with HCl 2N. Particulate inorganic carbon (PIC) was obtained by subtracting particulate organic carbon from particulate total carbon. Calcium concentrations were measured by ICP-OES (Inductively Coupled Plasma–Optic Emission Spectrometry; Perkin–Elmer© Optima 8000) on acid-digested samples (the organic matrix was removed by HNO3 while the mineral aluminosilicate matrix was eliminated with HF). Biogenic silica (BSi) and lithogenic silica (LSi) were measured by colorimetry (Analytikjena© Specor 250 plus spectrophotometer) after a NaOH/HF digestion, respectively (Mosseri et al., 2005). The carbonate fraction of the exported material was determined from particulate calcium concentrations %. The organic matter fraction was calculated as 2×%POC (Klaas and Archer, 2002) The lithogenic fraction was calculated as [)] and was very comparable to the lithogenic fraction calculated from LSi (taking Si concentration in dust analog used for seeding from Desboeufs et al., 2014; ca. 11.9 %). In the controls, the amount of material exported was low and the entire content of the traps was filtered in order to measure total mass and organic matter mass fluxes. Measured concentrations on blank filters were 1.1 % of the average concentration of the sample (thus negligible). For all analyses, replicate agreement was on average 0.3 %–2.3 %. No standard deviation was estimated as we analyze only two aliquots over the three when the two first measurements agree (<5 % difference) and that was the case for all the samples analyzed in this study.
2.4 Data processing
All metabolic rates were integrated over the duration of the experiments using trapezoidal integrations, and the relative changes (in %) in tanks D and G as compared to the controls (average between C1 and C2) were computed as follows:
where RateTreatment is the integrated rate measured in treatments D and G (D1, D2, G1 or G2) and RateControls is the averaged integrated rates between the duplicate controls (treatment C). Daily rates of 14C-based production were computed from hourly rates assuming a 14 h daylight period. As incubations performed from samples taken at t0 (before dust addition) do not represent what happened in the tanks between t0 and t24 h, as a first assumption, we considered a linear evolution between these rates and those measured from samples at t24 h and recomputed an average value for the time interval t0−t24 h. At FAST, no incubations were performed for 14C incorporation and oxygen metabolism between t72 h and t96 h; again an average rate between rates measured from samples taken at t48 h and t96 h was used for this time interval. Since bacterial respiration rates were not measured, bacterial growth efficiency (BGE, expressed as a percentage) was estimated based on BP (carbon units) and community respiration (CR, oxygen units). As BP was determined more often than CR during the first 48 h, hourly BP rates were integrated using trapezoidal integrations during the time period when CR was measured. We assumed that heterotrophic prokaryotes were responsible for 70 % of CR (BRCR ratio; Lemée et al., 2002) and used a respiratory quotient (RQ) of 0.8 (del Giorgio and Williams, 2005), following this equation:
When BP varied following an exponential growth, we calculated growth rates (µBP) from linear least square regression of the natural logarithm of BP rates versus time.
3.1 Initial conditions
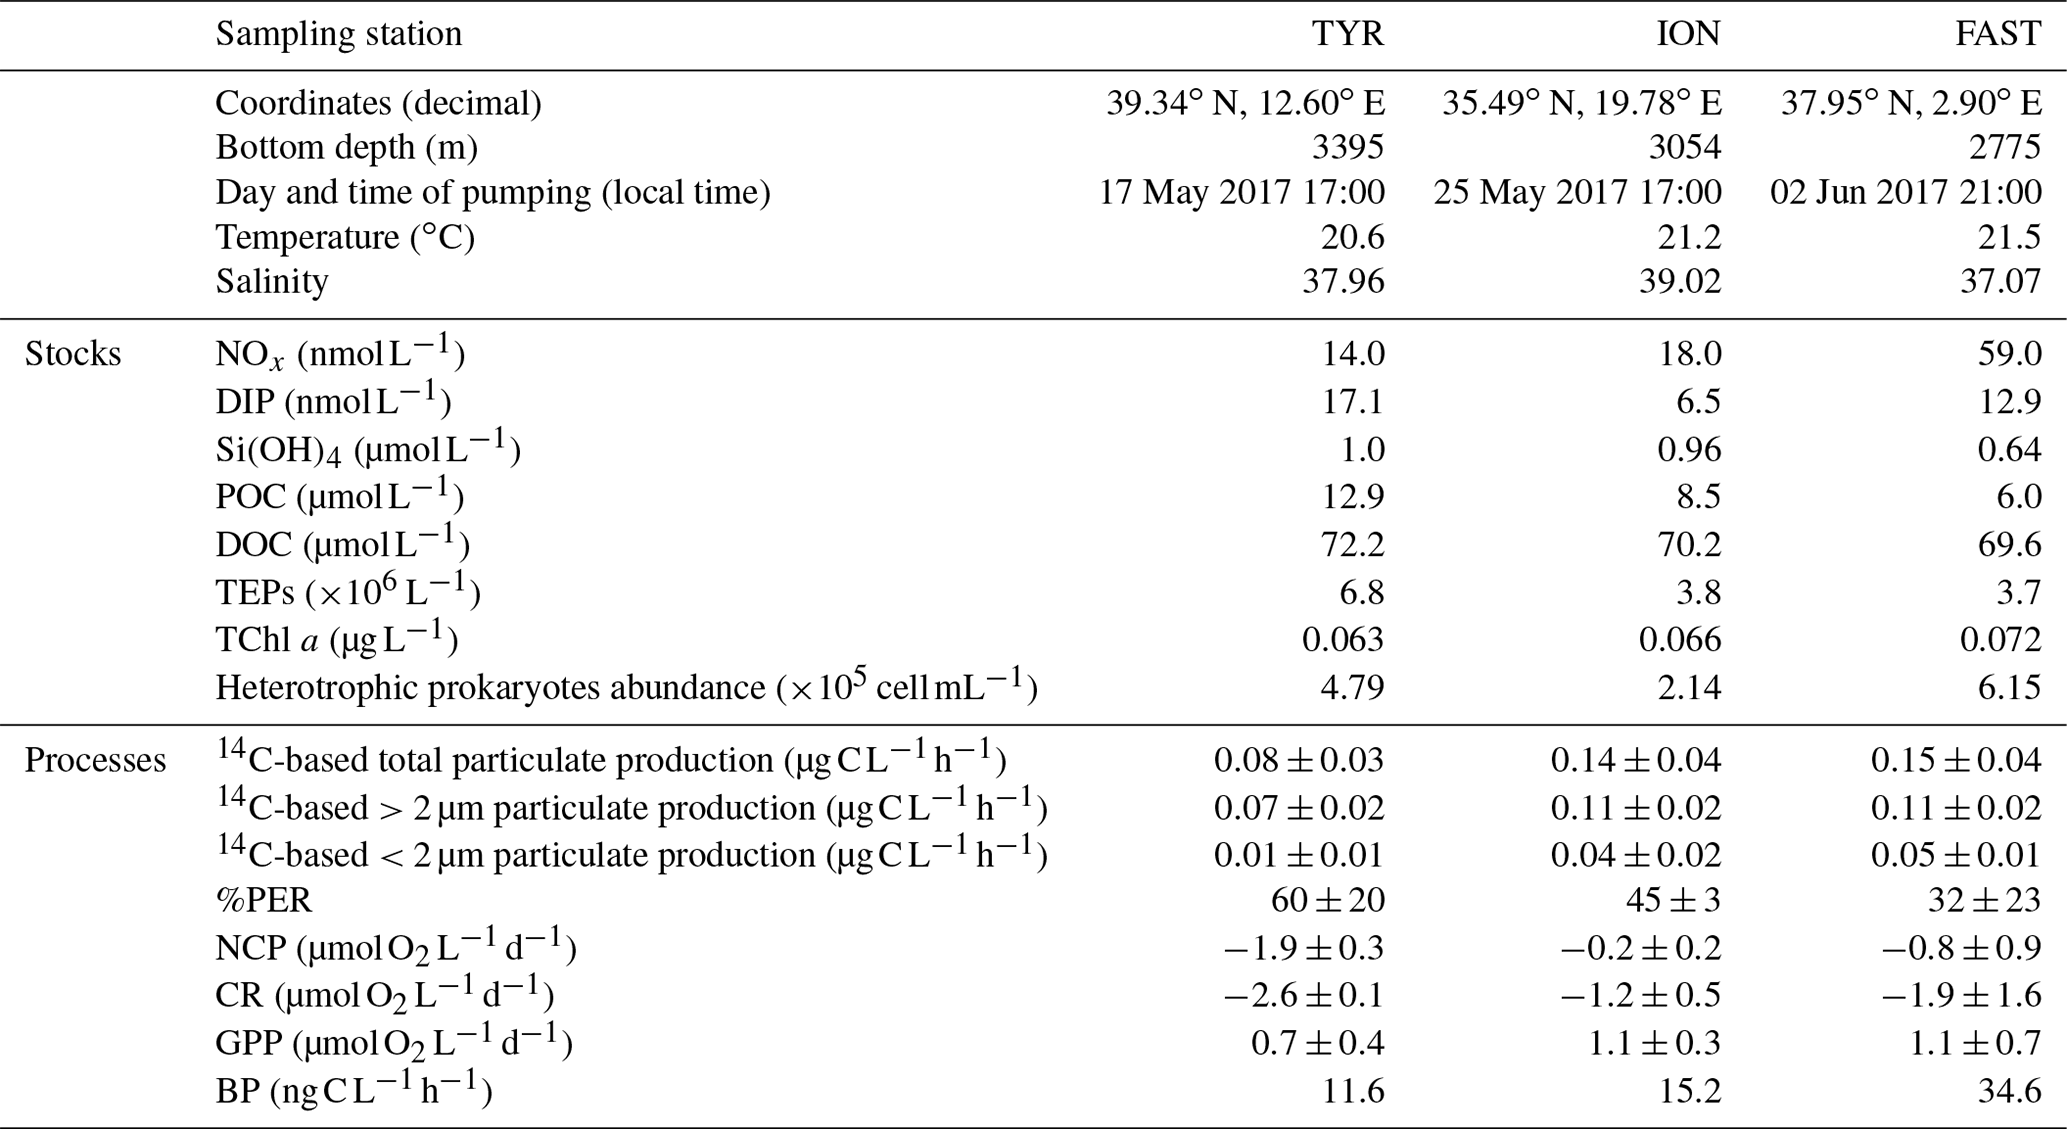
Initial conditions in terms of the chemical and biological standing stocks measured while filling the tanks at the three stations are fully described in Gazeau et al. (2021). Briefly, the three experiments were conducted with surface seawater collected during stratified oligotrophic conditions typical of the open Mediterranean Sea at this period of the year (Table 1). Nevertheless, a dust event took place nine days before sampling at station TYR as evidenced from the particulate inventory of lithogenic proxies (Al, Fe) in the water column (Bressac et al., 2021), likely stimulating phytoplankton growth before the start of the experiment. Nitrate and nitrite (NOx) concentrations were maximal at station FAST with a NOx to dissolved inorganic phosphate (DIP) molar ratio of ∼4.6. Very low NOx concentrations were observed at stations TYR and ION (14 and 18 nmol L−1, respectively). DIP concentrations were the highest at station TYR (17 nmol L−1) and the lowest at the most eastern station (ION, 7 nmol L−1). Consequently, the lowest NOx:DIP ratio was measured at TYR (0.8), compared to ION and FAST (2.8 and 4.6, respectively). Silicate (Si(OH4)) concentrations were similar at TYR and ION (∼1 µmol L−1) and the lowest at FAST (∼0.6 µmol L−1). Both POC and DOC concentrations were the highest at station TYR (12.9 and 72.2 µmol L−1, respectively) and the lowest at FAST (6.0 and 69.6 µmol L−1, respectively). Very low and similar concentrations of chlorophyll a were measured at the three stations (0.063–0.072 µg L−1). Phytoplankton communities at stations TYR and ION were dominated by prymnesiophytes followed by cyanobacteria, while, at station FAST, the phytoplanktonic community was clearly dominated by photosynthetic prokaryotes. At all three stations, the proportion of pigments representative of larger species was very small (<5 %; Gazeau et al., 2021). Heterotrophic prokaryotes were the most abundant at station FAST (6.15×10⁵ cells mL−1) and the least abundant at station ION (2.14×10⁵ cells mL−1).
Table 1Initial chemical and biological stocks as measured while filling the tanks (initial conditions in pumped surface water; sampling time: t−12 h). NOx: nitrate and nitrite, DIP: dissolved inorganic phosphorus, Si(OH)4: silicate, POC: particulate organic carbon, DOC: dissolved organic carbon, TEPs: transparent exopolymer particles, TChl a: total chlorophyll a. Values shown for 14C incorporation rates and percentages of extracellular release (%PER) as well as for net community production (NCP), community respiration (CR) and gross primary production (GPP) were estimated from samples taken at t0 in the control tanks. For heterotrophic bacterial production (BP), rates were estimated from seawater sampled at t−12 h.
Relatively similar 14C-based particulate production rates were measured at the start of the experiments (t0) in the control tanks (C1 and C2) at station ION and FAST (ca. 0.014–0.015 ). At both stations, ca. 80 % of the production was attributed to larger (>2 µm) cells and the percentage of extracellular release (%PER) did not exceed 45 %. Lower rates were estimated at station TYR (total particulate production of 0.08 ) from which 87.5 % was due to large cells >2 µm. A larger amount of 14C incorporation was released as dissolved organic matter at station TYR compared to the two other stations (PER ca. 60 %). Metabolic balance derived from oxygen measurements showed that, at all three stations, the community was net heterotrophic with a higher degree of heterotrophy at station TYR (NCPs were −1.9, −0.2 and −0.8 at TYR, ION and FAST, respectively, as measured in the controls from seawater sampled at t0). CR and GPP rates were respectively the highest and the lowest at station TYR compared to the other two stations. Finally, BP rates were the highest at station FAST (35.8 ), intermediate at ION (26.1 ) and the lowest at TYR (21.3 ).
3.2 Changes in biological stocks
DOC concentrations showed a general positive trend during the three experiments and a large variability between duplicates (Fig. 2). This variability appeared as soon as 1 h after dust seeding (t1 h) while the range of variation at t0 (before dust seeding) was rather moderate (difference between minimal and maximal values in all tanks of 1.3, 6.2 and 4.3 µmol C L−1 at station TYR, ION and FAST, respectively). As a consequence of this variability, no clear impact of dust seeding (D) could be highlighted at station TYR and FAST. Indeed, DOC concentrations in the two duplicates (D1 and D2) were higher than values in the controls (C1 and C2) in only 33 % of the samples along the experiments (after dust seeding). In contrast, at station ION, DOC concentrations appeared impacted by dust seeding as higher concentrations were almost systematically (83 % of the time after dust seeding) measured for this treatment as compared to control tanks at the same time. At all stations, this impact was somewhat exacerbated under conditions of temperature and pH projected for 2100 (G1 and G2) as DOC concentrations were higher almost all the time in these tanks than in control tanks (83 %–100 % of the samples after dust seeding, depending on the station).
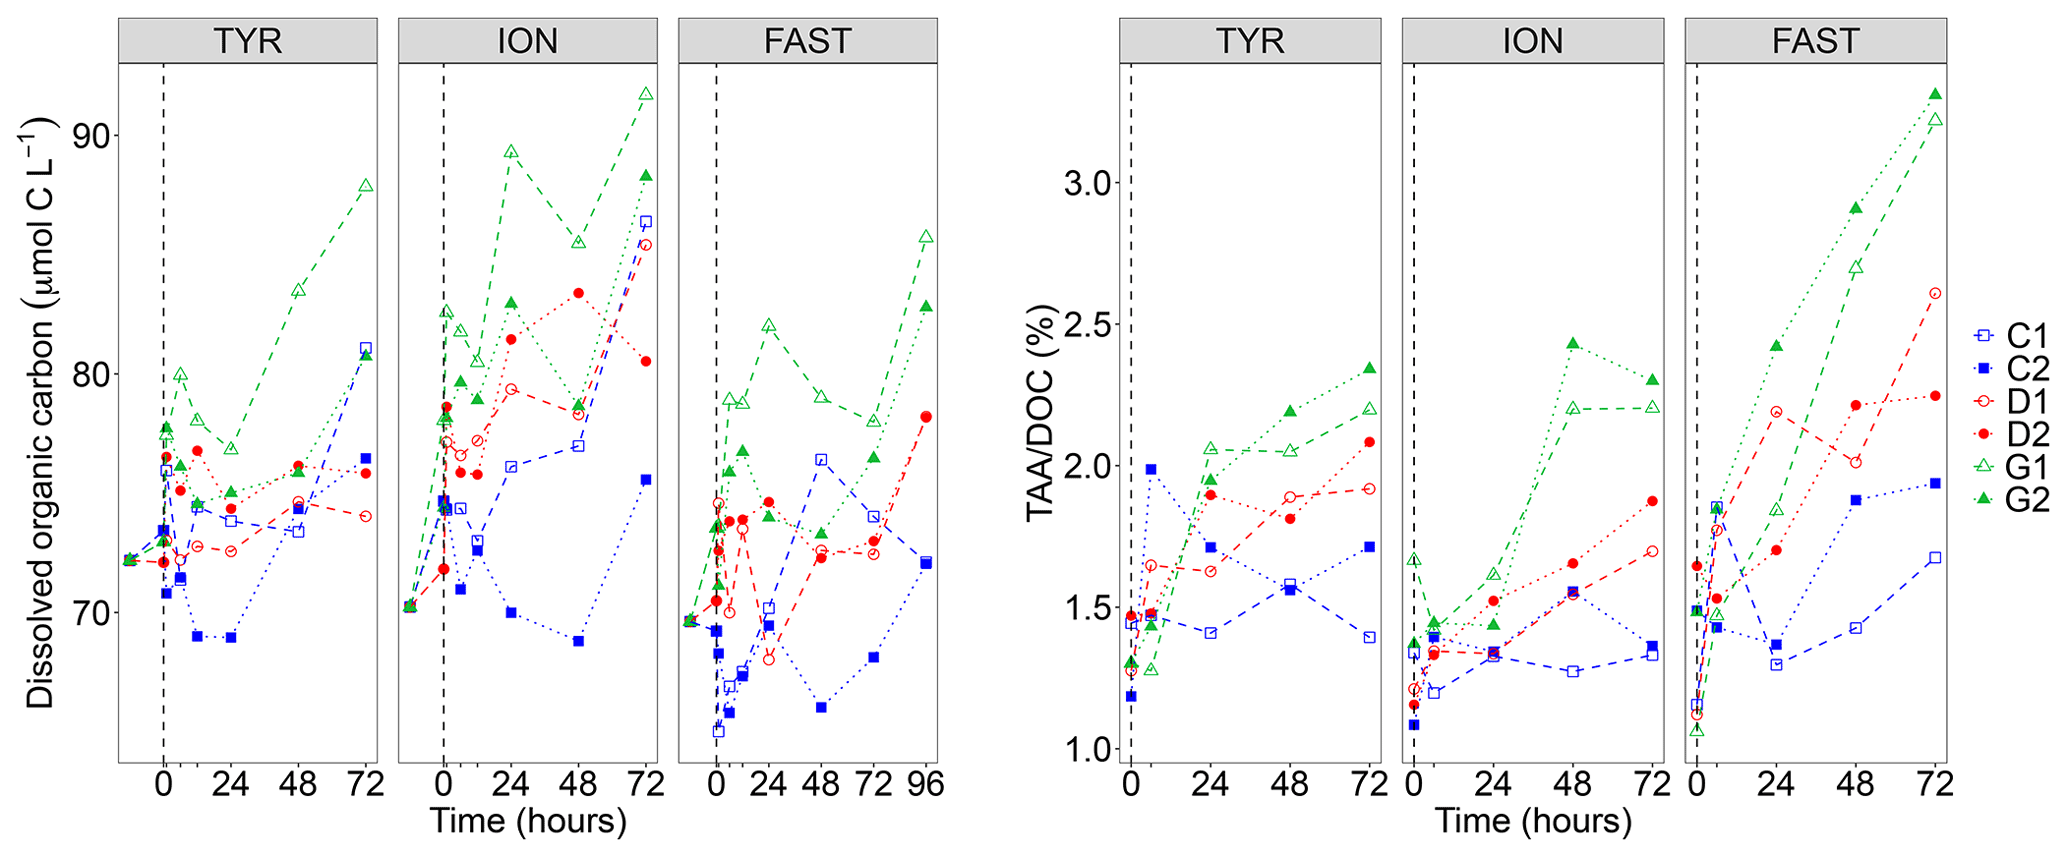
Figure 2Dissolved organic carbon (DOC) concentrations and ratio between total hydrolysable amino acids (TAA) and DOC concentrations measured in the six tanks (controls: C1, C2; dust addition under present conditions of temperature and pH: D1, D2; dust addition under future conditions of temperature and pH: G1 and G2) during the three experiments (TYR, ION and FAST). The dashed vertical line indicates the time of seeding (after t0).
Total hydrolysable carbohydrates and amino acid concentrations along the three experiments are shown in Fig. S2 in the Supplement. TCHO concentrations were quite variable between tanks before dust seeding (t0; 649–954, 569–660 and 600–744 nmol L−1 at station TYR, ION and FAST, respectively), and no visible impact of the treatments was visible at station TYR (TCHO tended to decrease everywhere). In contrast, at station ION and FAST, values in dust-amended tanks increased and appeared higher than in control tanks towards the end of the experiments, although the large variability between duplicates tended to mask this potential effect. An impact of dust seeding was much clearer for TAA concentrations that showed larger increases throughout the three experiments in tanks D1 and D2 as compared to control tanks, this effect being exacerbated for warmer and acidified tanks (G1 and G2). The ratio between TAA and DOC concentrations (Fig. 2) showed positive trends in tanks D and G during all three experiments with a clear distinction between treatments at the end of the experiments (). The strongest increase was observed at station FAST in tanks G where final TAADOC ratios were above 3 %.
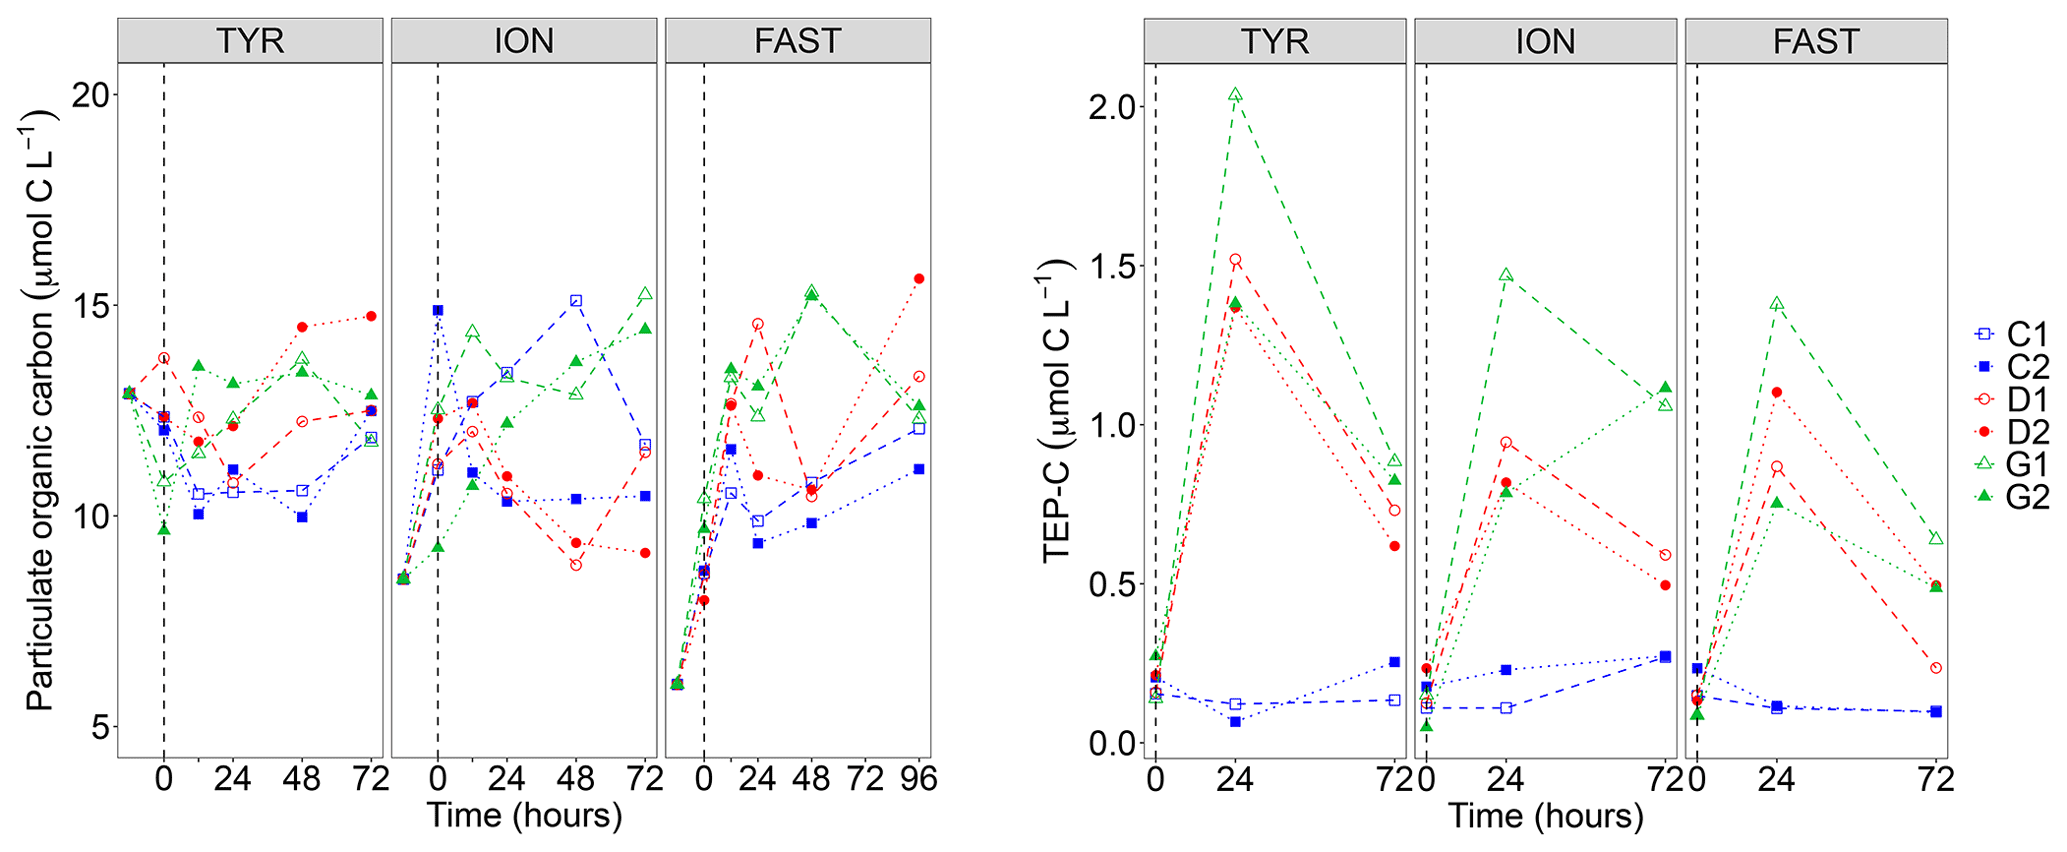
Figure 3Particulate organic carbon (POC) concentrations and transparent exopolymer particle carbon content (TEP-C) measured in the six tanks (controls: C1, C2; dust addition under present conditions of temperature and pH: D1, D2; dust addition under future conditions of temperature and pH: G1 and G2) during the three experiments (TYR, ION and FAST). The dashed vertical line indicates the time of seeding (after t0).
Particulate organic carbon (POC) concentrations strongly decreased at all stations between t−12 h and t0, this decrease being the largest at station TYR where concentrations dropped from 25.7 to 9.6–13.2 µmol C L−1 (Fig. 3). After dust seeding, POC concentrations did not show clear temporal trends for the three experiments although a slight general increase could be observed at station FAST. Furthermore, no impact of dust seeding and warming/acidification could be observed on POC dynamics. While concentrations of TEP-C were rather constant through time in control tanks at the three stations, a large increase was observed in dust-amended tanks (D and G) with TEP-C reaching values up to ∼2 µmol C L−1 in tank G1 at station TYR after 24 h (i.e., ∼17 % of POC concentration, Fig. 3). In all cases except for tank G2 at station ION, TEP-C further decreased towards the end of the experiments, although concentrations remained well above those observed in the controls. As the variability between duplicated tanks G was rather high, no impact of warming/acidification on TEP dynamics could be highlighted at the three stations.
3.3 Changes in metabolic rates
14C-based particulate production rates as measured during the different time intervals at the three stations were low in control tanks (maximal total particulate production of 0.34 at station FAST) and did not show any particular temporal dynamics (Fig. 4). In these tanks, the vast majority of particulate production was attributed to cells above 2 µm (65 %–89 %). The percentage of extracellular release (%PER) was overall maximal at station TYR and minimal at station FAST with a tendency to decrease with time at the three stations, although large variations were observed between duplicates.
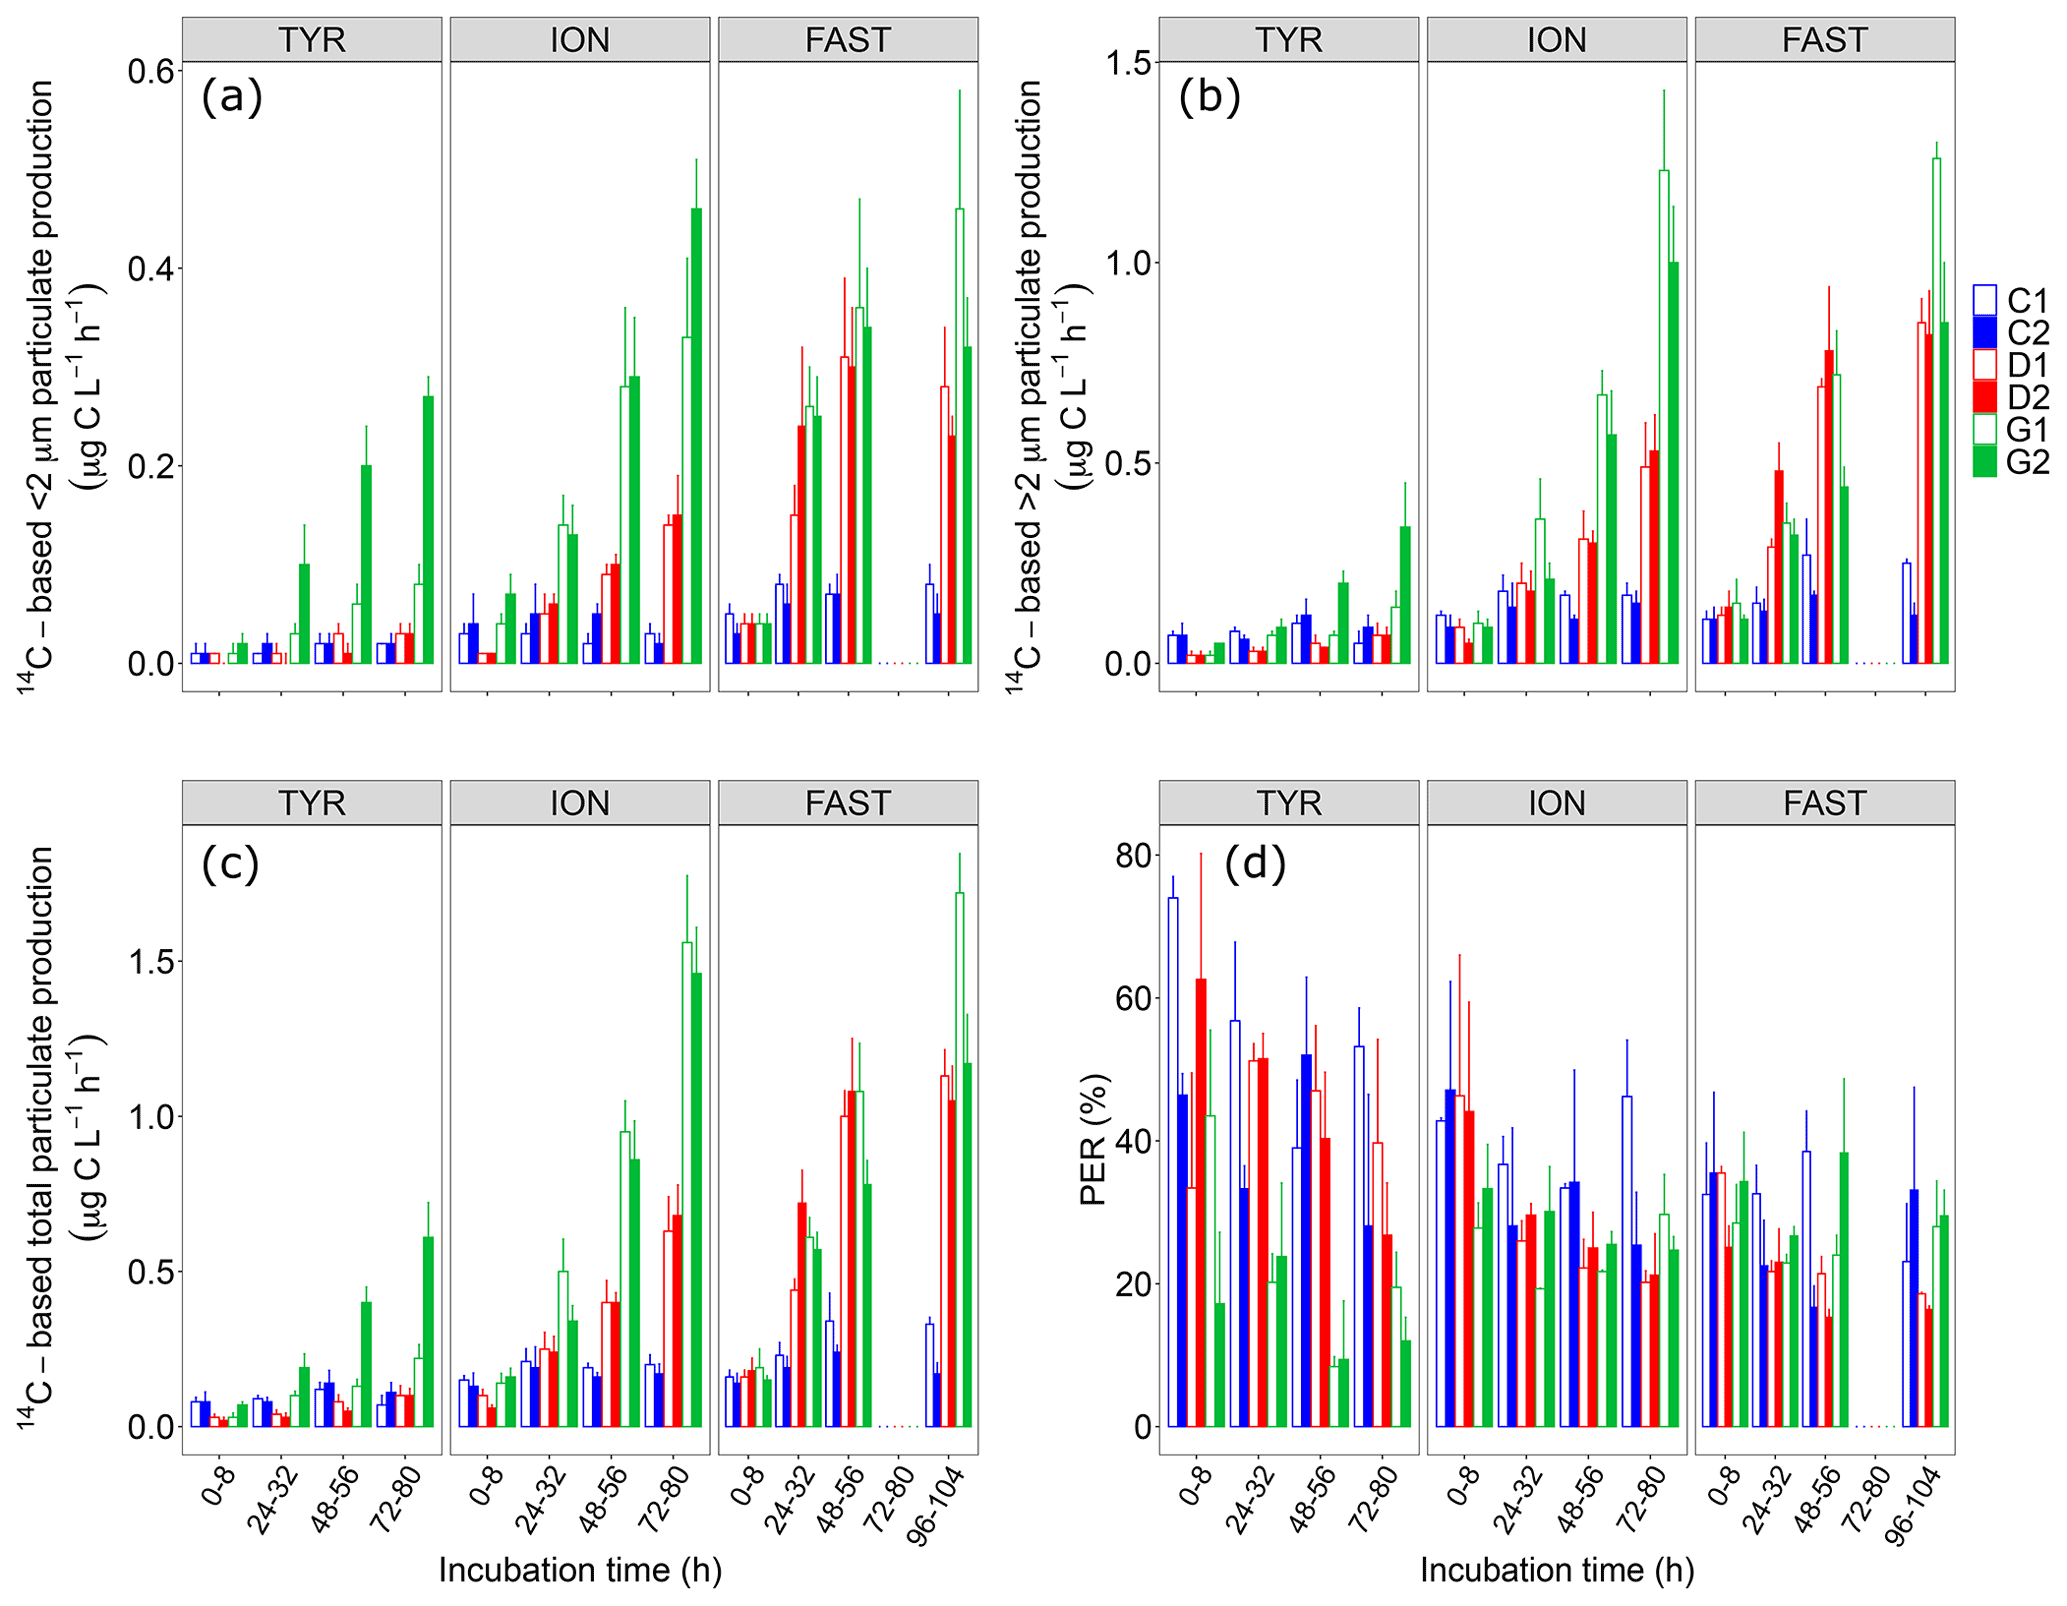
Figure 414C-based production rates ((a) <2 µm and (b) >2 µm size fractions, (c) total particulate) estimated from 8 h incubations on samples taken in the six tanks (controls: C1, C2; dust addition under present conditions of temperature and pH: D1, D2; dust addition under future conditions of temperature and pH: G1 and G2) during the three experiments (TYR, ION and FAST). The percentage of extracellular release (d, %PER) is also shown.
Dust addition alone did not have any clear positive impact on all 14C-based rates at station TYR, with even an observable decrease in production rates from larger cells (>2 µm) compared to the controls. In contrast, at this station, dust seeding under warmer and acidified conditions (tanks G) had a positive effect on particulate production rates, this effect being particularly visible for cells <2 µm and to a lesser extent on dissolved production with a general decrease in %PER. An important discrepancy between the duplicates of treatment G was observable at the end of the experiment with much larger rates measured in tank G2.
In contrast to station TYR, an enhancement effect of dust addition was clearly visible at station ION where all rates increased towards the end of this experiment reaching a maximal total particulate production of 0.6–0.7 in tanks D1 and D2. Since this positive effect was similar between small and larger cells, dust addition alone had no effect on the partitioning of production at this station, with cells >2 µm representing ∼80 % of total production. Although it was also positively impacted and increasing with time, dissolved production appeared less sensitive than particulate production leading to an overall decrease in %PER at station ION following dust addition. These positive impacts of dust seeding on 14C-based particulate production rates were even more visible at this station under warmer and acidified conditions (tanks G), with maximal rates more than doubled compared to those measured under present conditions of temperature and pH (1.5–1.6 ). Dust seeding under warmer and acidified conditions had a slight impact on the partitioning of particulate production at station ION, with smaller cells benefiting the most from these conditions. %PER remained between 20 % and 30 %.
At station FAST, similarly to station ION, total particulate production rates were clearly enhanced by dust addition (tanks D), reaching maximal values during the incubation time interval t48–56 h. No clear increase was observed for total particulate production on the next incubation (t96–120 h) while production rates of cells larger than 2 µm increased and rates of smaller cells decreased. However, in contrast to station ION, there was much less impact of warming/acidification on all measured rates at station FAST, although rates measured on smaller cells (<2 µm) did not decrease at the end of the experiment as observed under present environmental conditions. %PER under both present conditions of temperature and pH (tanks D) decreased during this experiment, reaching values lower than in the controls and in tanks G.
The initial enrichment of the tanks in 13C bicarbonate led to an increase in the 13C signature of dissolved inorganic carbon (δ13C CT) of above 300 ‰, with generally lower values measured in warmer and acidified tanks (G; Fig. S3 in the Supplement). After this initial enrichment, δ13C CT levels decreased linearly in all tanks. At stations TYR and ION, the isotopic signature of dissolved organic carbon (δ13C DOC; Fig. S3) increased with time, although these increases were rather low and limited to ∼4 ‰ over the course of the experiments. In contrast to station TYR, at ION, an enhanced incorporation of 13C into DOC was visible after 24 h in tanks D and G in comparison to control tanks. A similar observation was done at station FAST, especially at the end of the experiment, although much more variability was observed at this station.
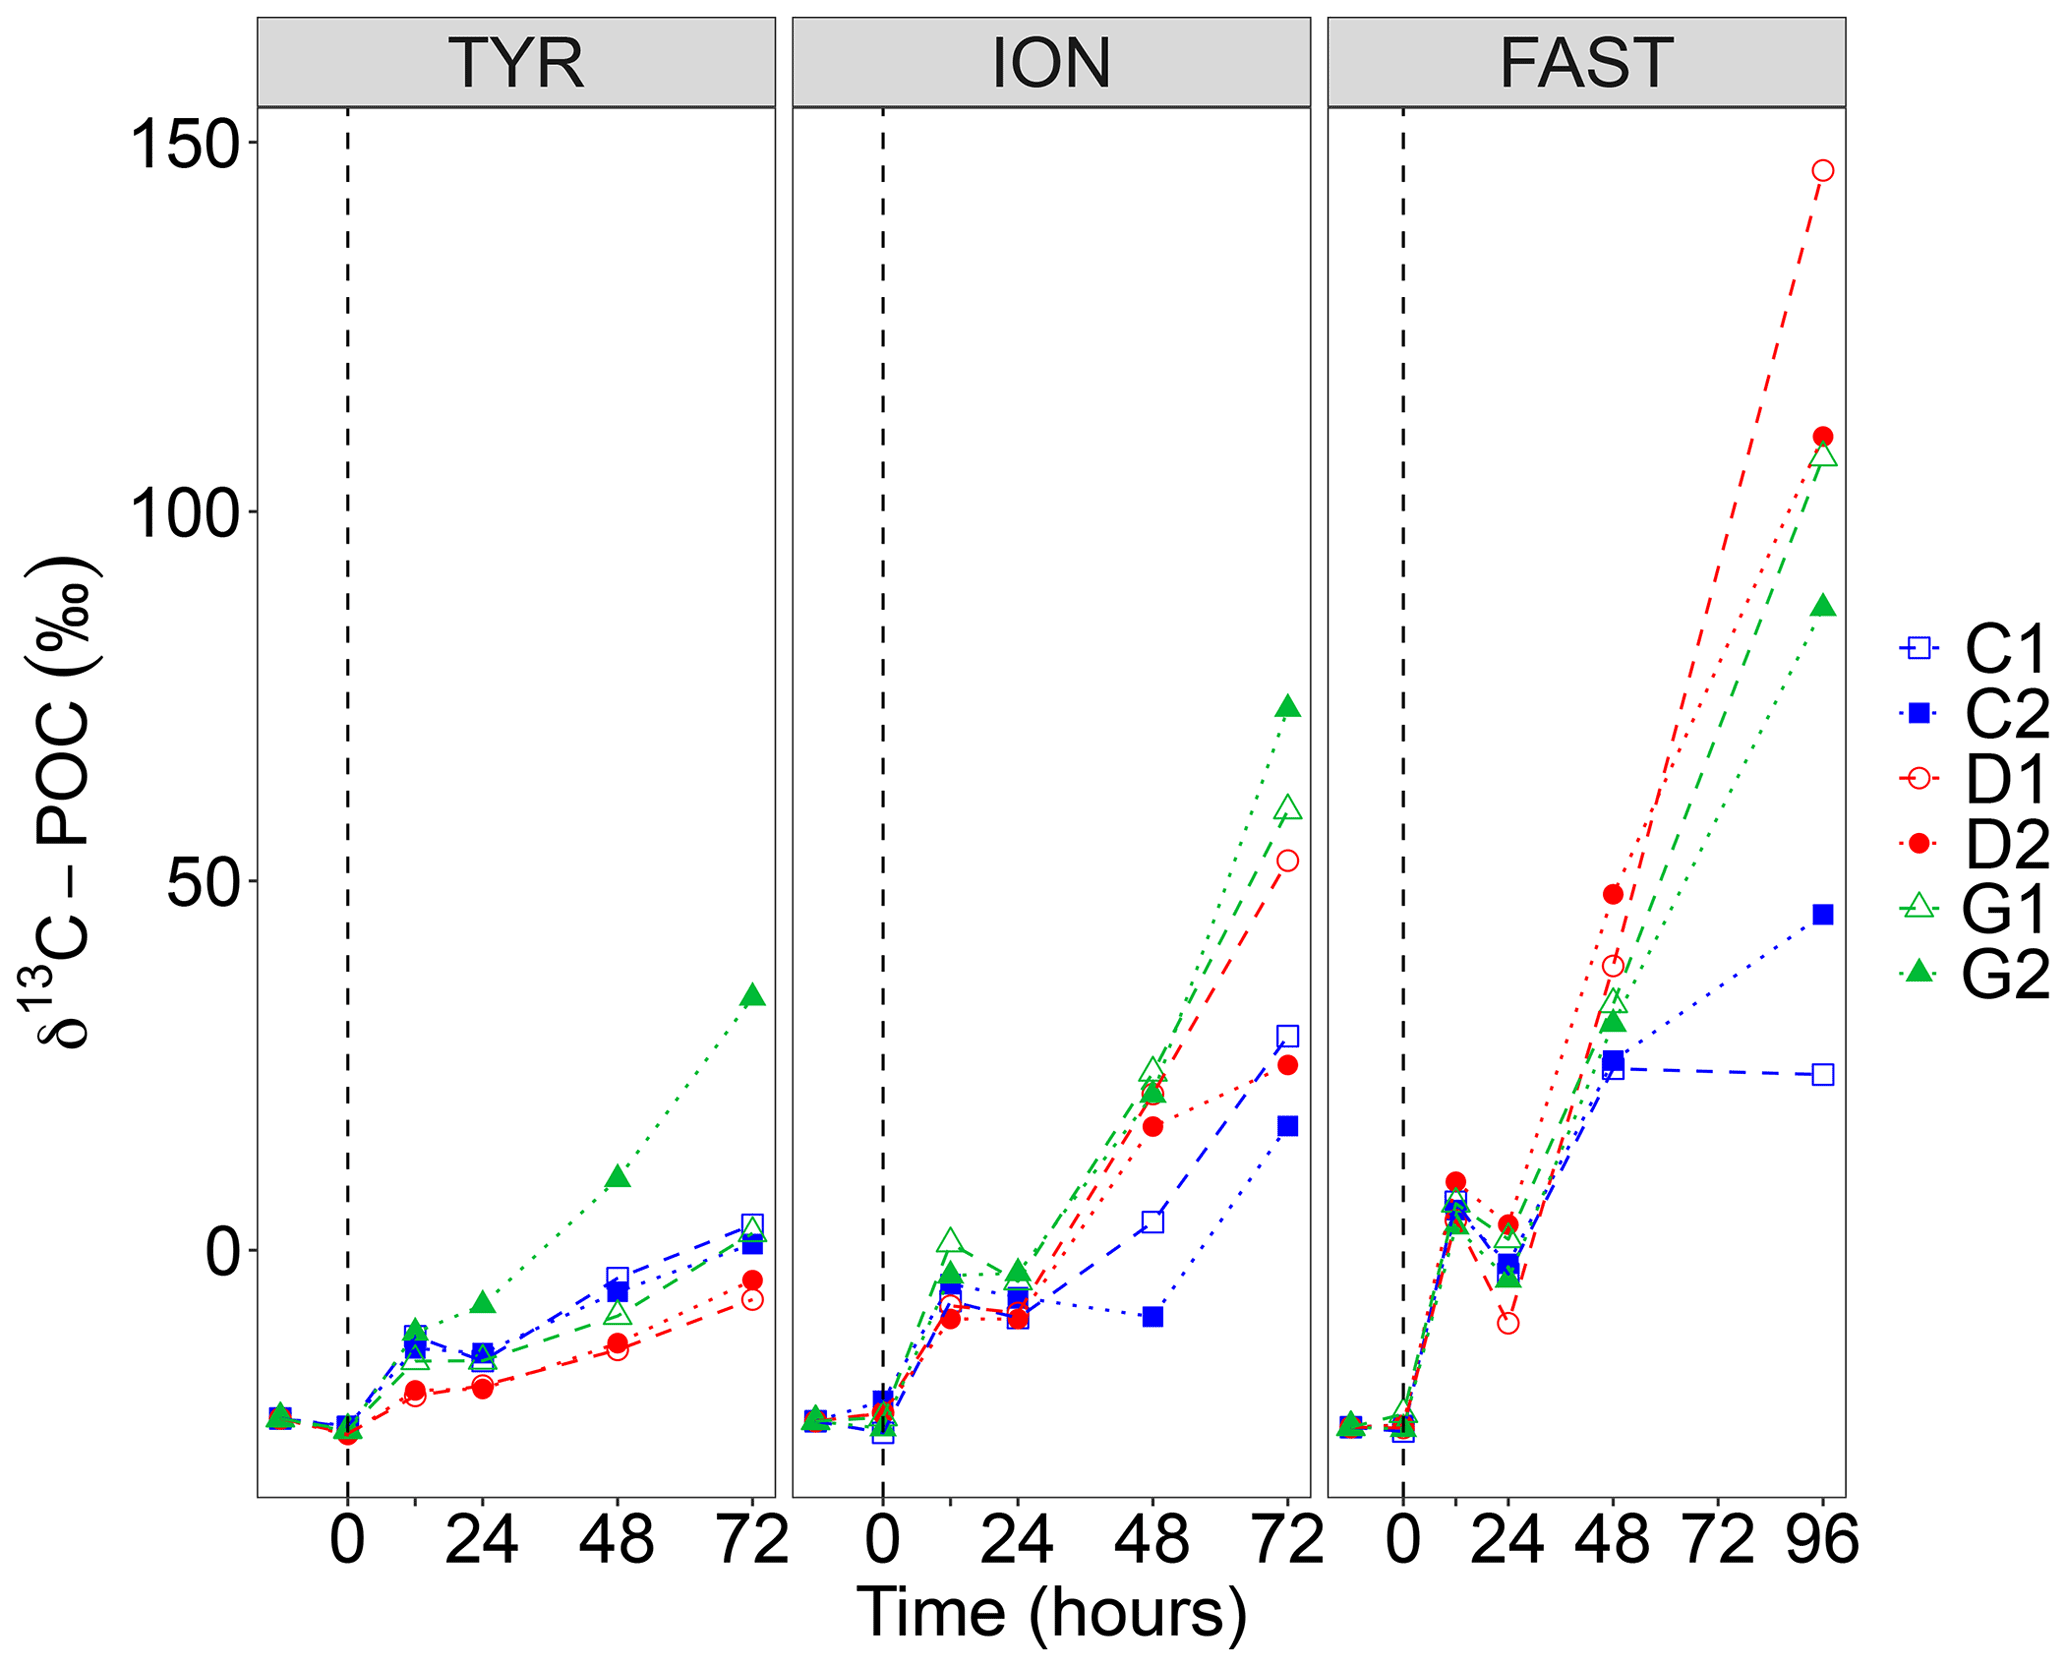
Figure 5Incorporation of 13C into particulate organic carbon (δ13C POC) in the six tanks (controls: C1, C2; dust addition under present conditions of temperature and pH: D1, D2; dust addition under future conditions of temperature and pH: G1 and G2) during the three experiments (TYR, ION and FAST). The dashed vertical line indicates the time of seeding (after t0).
The incorporation of 13C into particulate organic carbon (δ13C POC) is shown in Fig. 5. At all stations, δ13C POC increased with time but reached lower enrichment levels at station TYR as compared to ION and FAST. At station TYR, incorporation rates appeared smaller in dust-amended tanks under present environmental conditions (tanks D). As for 14C-based production rates, an important discrepancy was observed between duplicates under future conditions of temperature and pH (tanks G) with much higher final δ13C POC at the end of the experiment in tank G2. At station ION, enrichment levels obtained at the end of the experiment were more important in dust-amended tanks reaching maximal levels of 73 ‰ in tank G2 at t72 h. This enhancement effect was even more visible at station FAST with maximal enrichment levels of 146 ‰ (tank D2 at t96 h). Since no sampling occurred at t72 h, these enrichment levels cannot be directly compared to what was measured at station TYR and ION. However, by interpolating values at t72 h assuming a linear increase between these time intervals, enrichment levels appeared similar although slightly higher for tanks D between station ION and FAST.
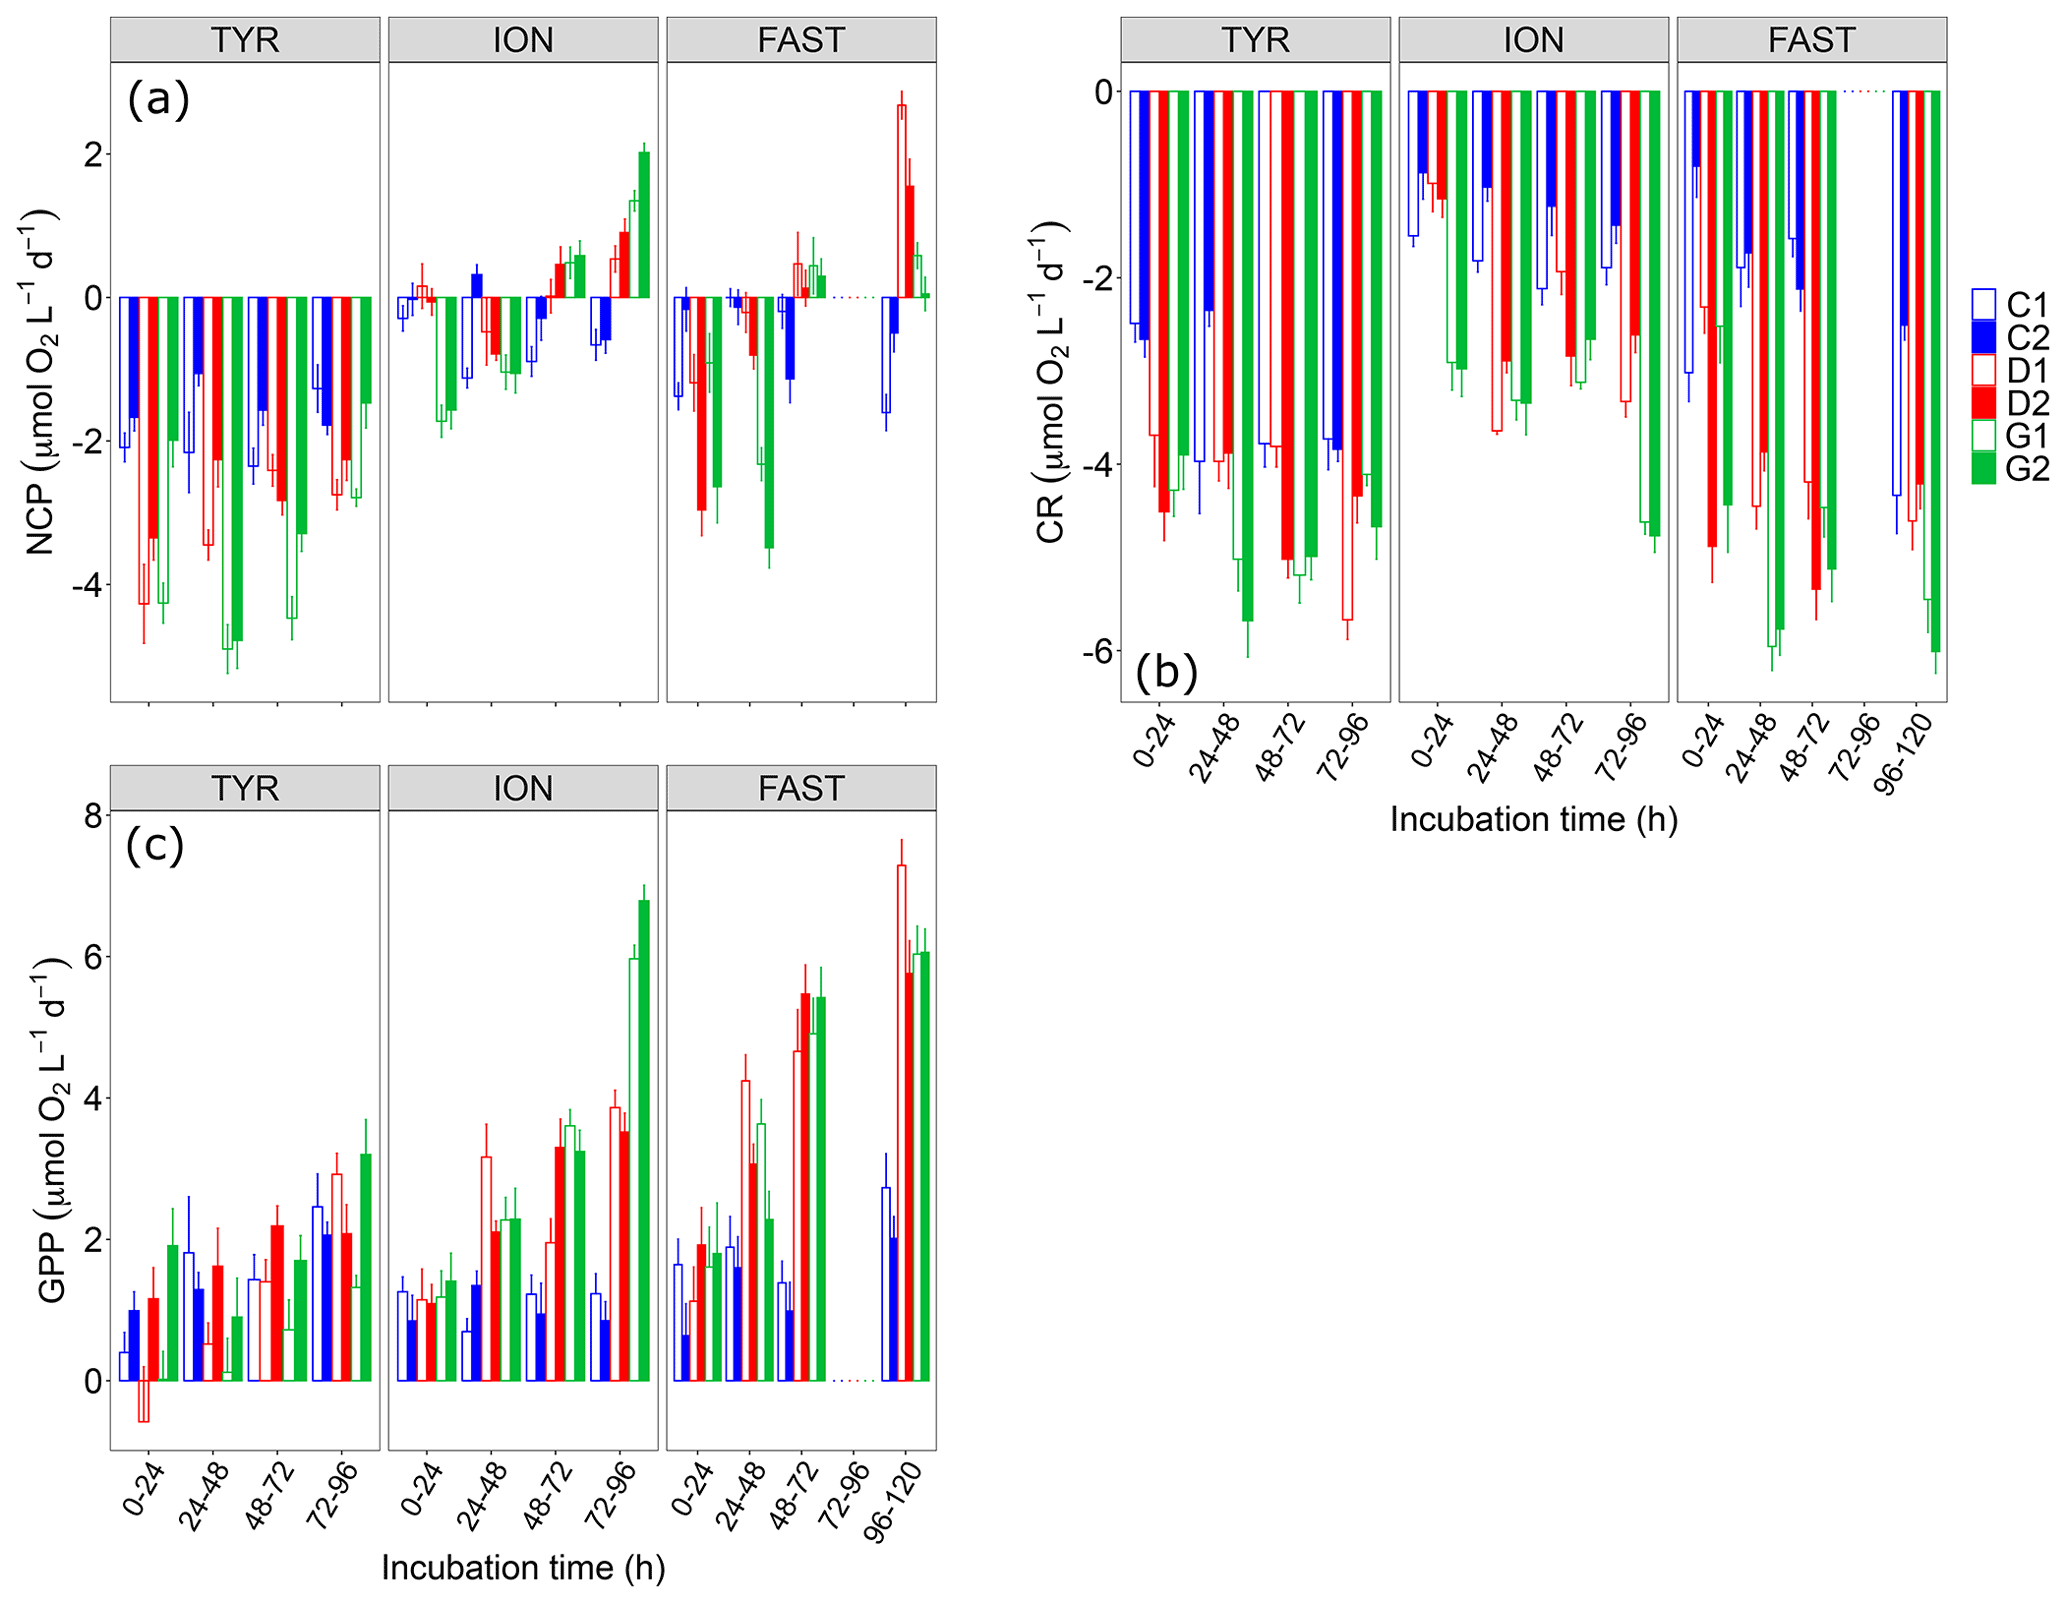
Figure 6(a) Net community production (NCP), (b) community respiration (CR) and (c) gross primary production (GPP) rates estimated using the oxygen light–dark method (24 h incubations) on samples taken in the six tanks (C1, C2, D1, D2, G1 and G2) during the three experiments (TYR, ION and FAST).
NCP rates as measured using the O2 light–dark method showed that, under control conditions, the communities remained in a net heterotrophic state (NCP<0; Fig. 6) the vast majority of the time throughout the three experiments. This was especially true at station TYR where the lowest NCP rates were measured. At this station, dust addition whether under present or future conditions of temperature and pH did not switch the community towards net autotrophy but even drove the community towards a stronger heterotrophy. This was related to the fact that while gross primary production rates were not positively impacted, community respiration increased in tanks D and G. At station ION, dust addition alone (tanks D) led to a switch from net heterotrophy to net autotrophy after two days of incubation due to a stronger positive effect of dust on GPP than on CR. Under future environmental conditions (tanks G), the same observation was made with higher NCP and GPP rates than in tanks D. CR rates reacted quickly to these forcing factors in tanks G and initially (first incubation) drove the community towards a much stronger heterotrophy as compared to the other tanks. Finally, at station FAST, similarly to what was observed at ION, the community became autotrophic after two days of incubation in dust-amended tanks as, although both GPP and CR were positively impacted by dust addition, this impact was less important for CR. Warming and acidification had a limiting impact on this enhancement, with a lower final NCP in tanks G compared to tanks D, a difference that can be related to an absence of effects of these environmental stressors on GPP while CR clearly increased at higher temperature and lower pH.
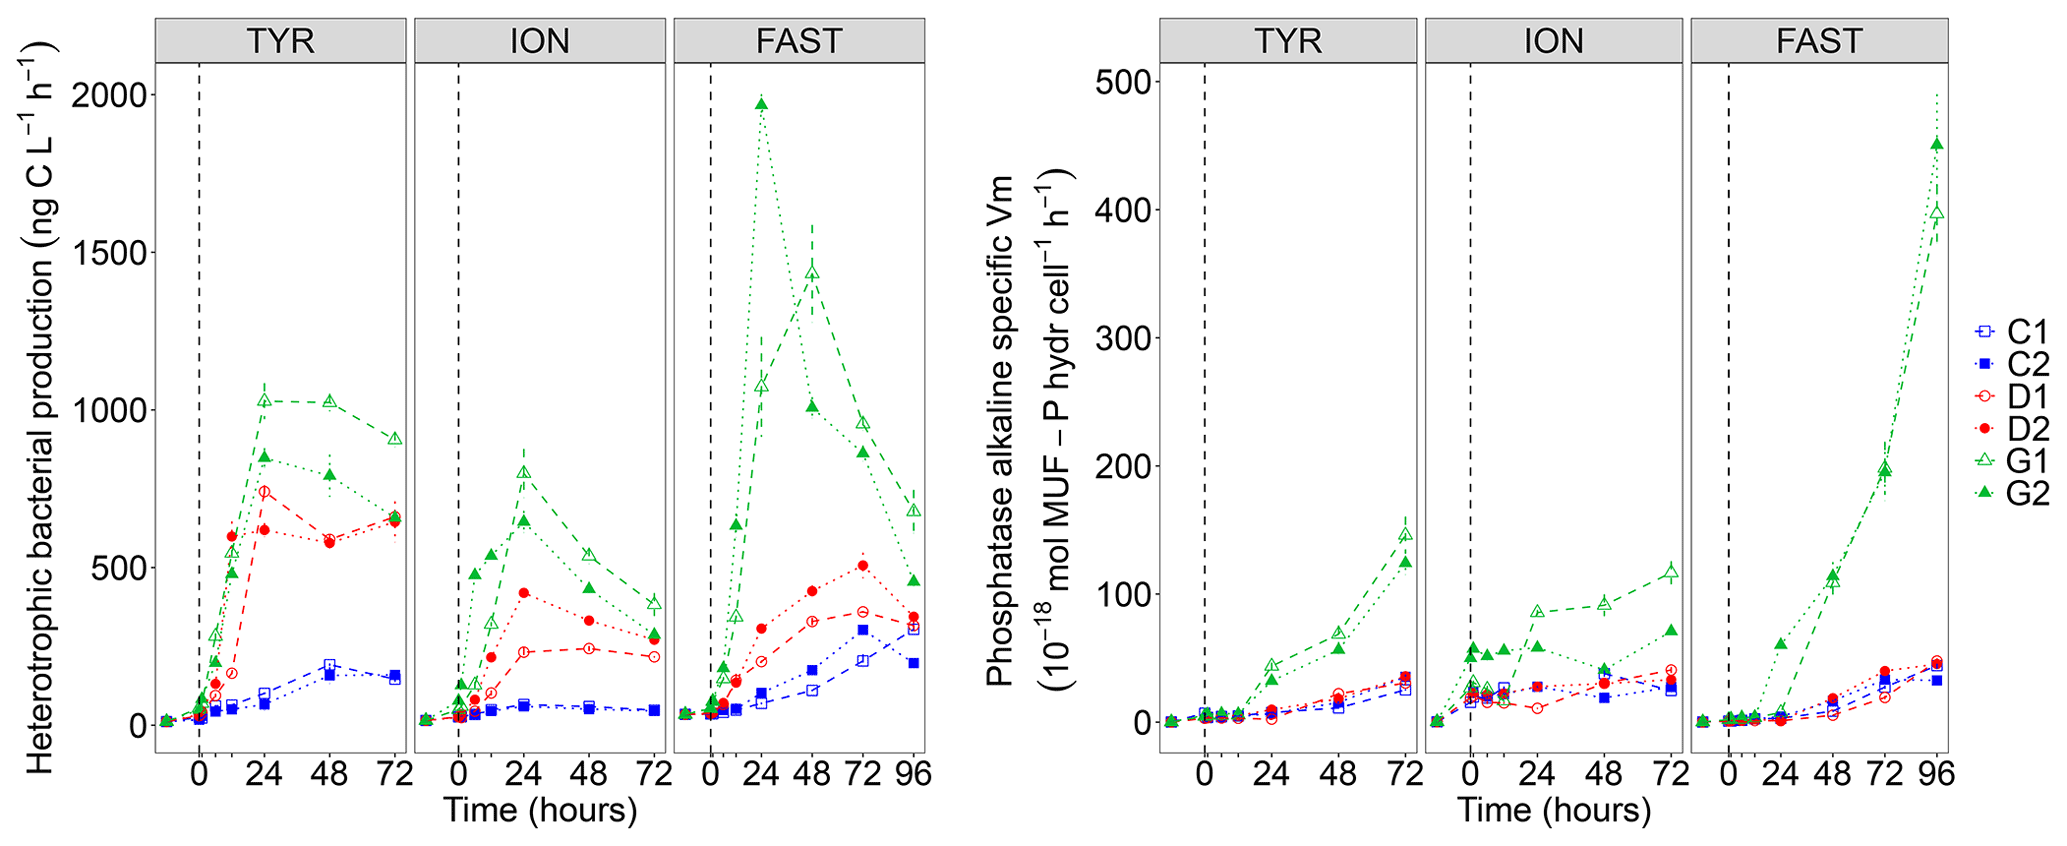
Figure 7Heterotrophic bacterial production rates (BP) and cell-specific maximum hydrolysis velocity (Vm) of the alkaline phosphatase (both over 1–2 h incubations) on samples taken in the six tanks (C1, C2, D1, D2, G1 and G2) during the three experiments (TYR, ION and FAST).
While BP remained constant or gradually increased in control tanks depending on the station, a clear and quick fertilization effect was observable following dust addition (treatment D and G) at all stations (Fig. 7). At station TYR, BP rates sharply increased to reach maximal values at t24 h, with an even stronger increase observed under warmer and acidified conditions (tanks G). After this initial increase, rates slightly decreased towards the end of the experiment. This fertilization effect appeared less important at station ION where lower maximal rates were obtained after 24 h as compared to station TYR. Nevertheless, the same observations can be made, namely, (1) higher rates were measured under future temperature and pH levels and (2) after this initial sharp increase, rates gradually decreased towards the end of the experiment especially in tanks G. At station FAST, a much stronger effect of warming/acidification was observed with an important increase in BP in tanks G until 24 or 48 h post-seeding, depending on the duplicate. A sharp decline was observed for this treatment until the end of the experiment although rates remained higher than those measured in tanks C and D. The impact of dust addition under present environmental conditions (tanks D) was somehow more limited than at the other stations with a gradual increase until t72 h with maximal rates ∼40–100 % higher than rates measured in the controls. However, BP increased exponentially between t0 and t12 h in all tanks including controls, and in all experiments (Table 2). The growth rate of BP (µBP) in control tanks was the highest at TYR, intermediate at ION and the lowest at FAST. µBP increased significantly in all dust-amended tanks compared to controls. Under future environmental scenarios, µBP tended to increase compared to treatment D but with a variable relative change (Table 2).
Table 2Heterotrophic bacterial production (BP) growth rates (μBP in h−1) estimated from the exponential phase of BP growth, observable from at least four sampling points, between t0 and t12 h, during the three experiments (TYR, ION and FAST) in the six tanks (controls: C1, C2; dust addition under present conditions of temperature and pH: D1, D2; dust addition under future conditions of temperature and pH: G1 and G2). Values±SE are shown.

Table 3Estimated bacterial growth efficiency (BGE in %) during the course of the three experiments (TYR, ION and FAST) in the six tanks (controls: C1, C2; dust addition under present conditions of temperature and pH: D1, D2; dust addition under future conditions of temperature and pH: G1 and G2). BGE was calculated based on integrated heterotrophic bacterial production (BP) and community respiration (CR) rates by applying a bacterial respiration to a CR ratio of 0.7 and a respiratory quotient of 0.8 (see Material and methods).
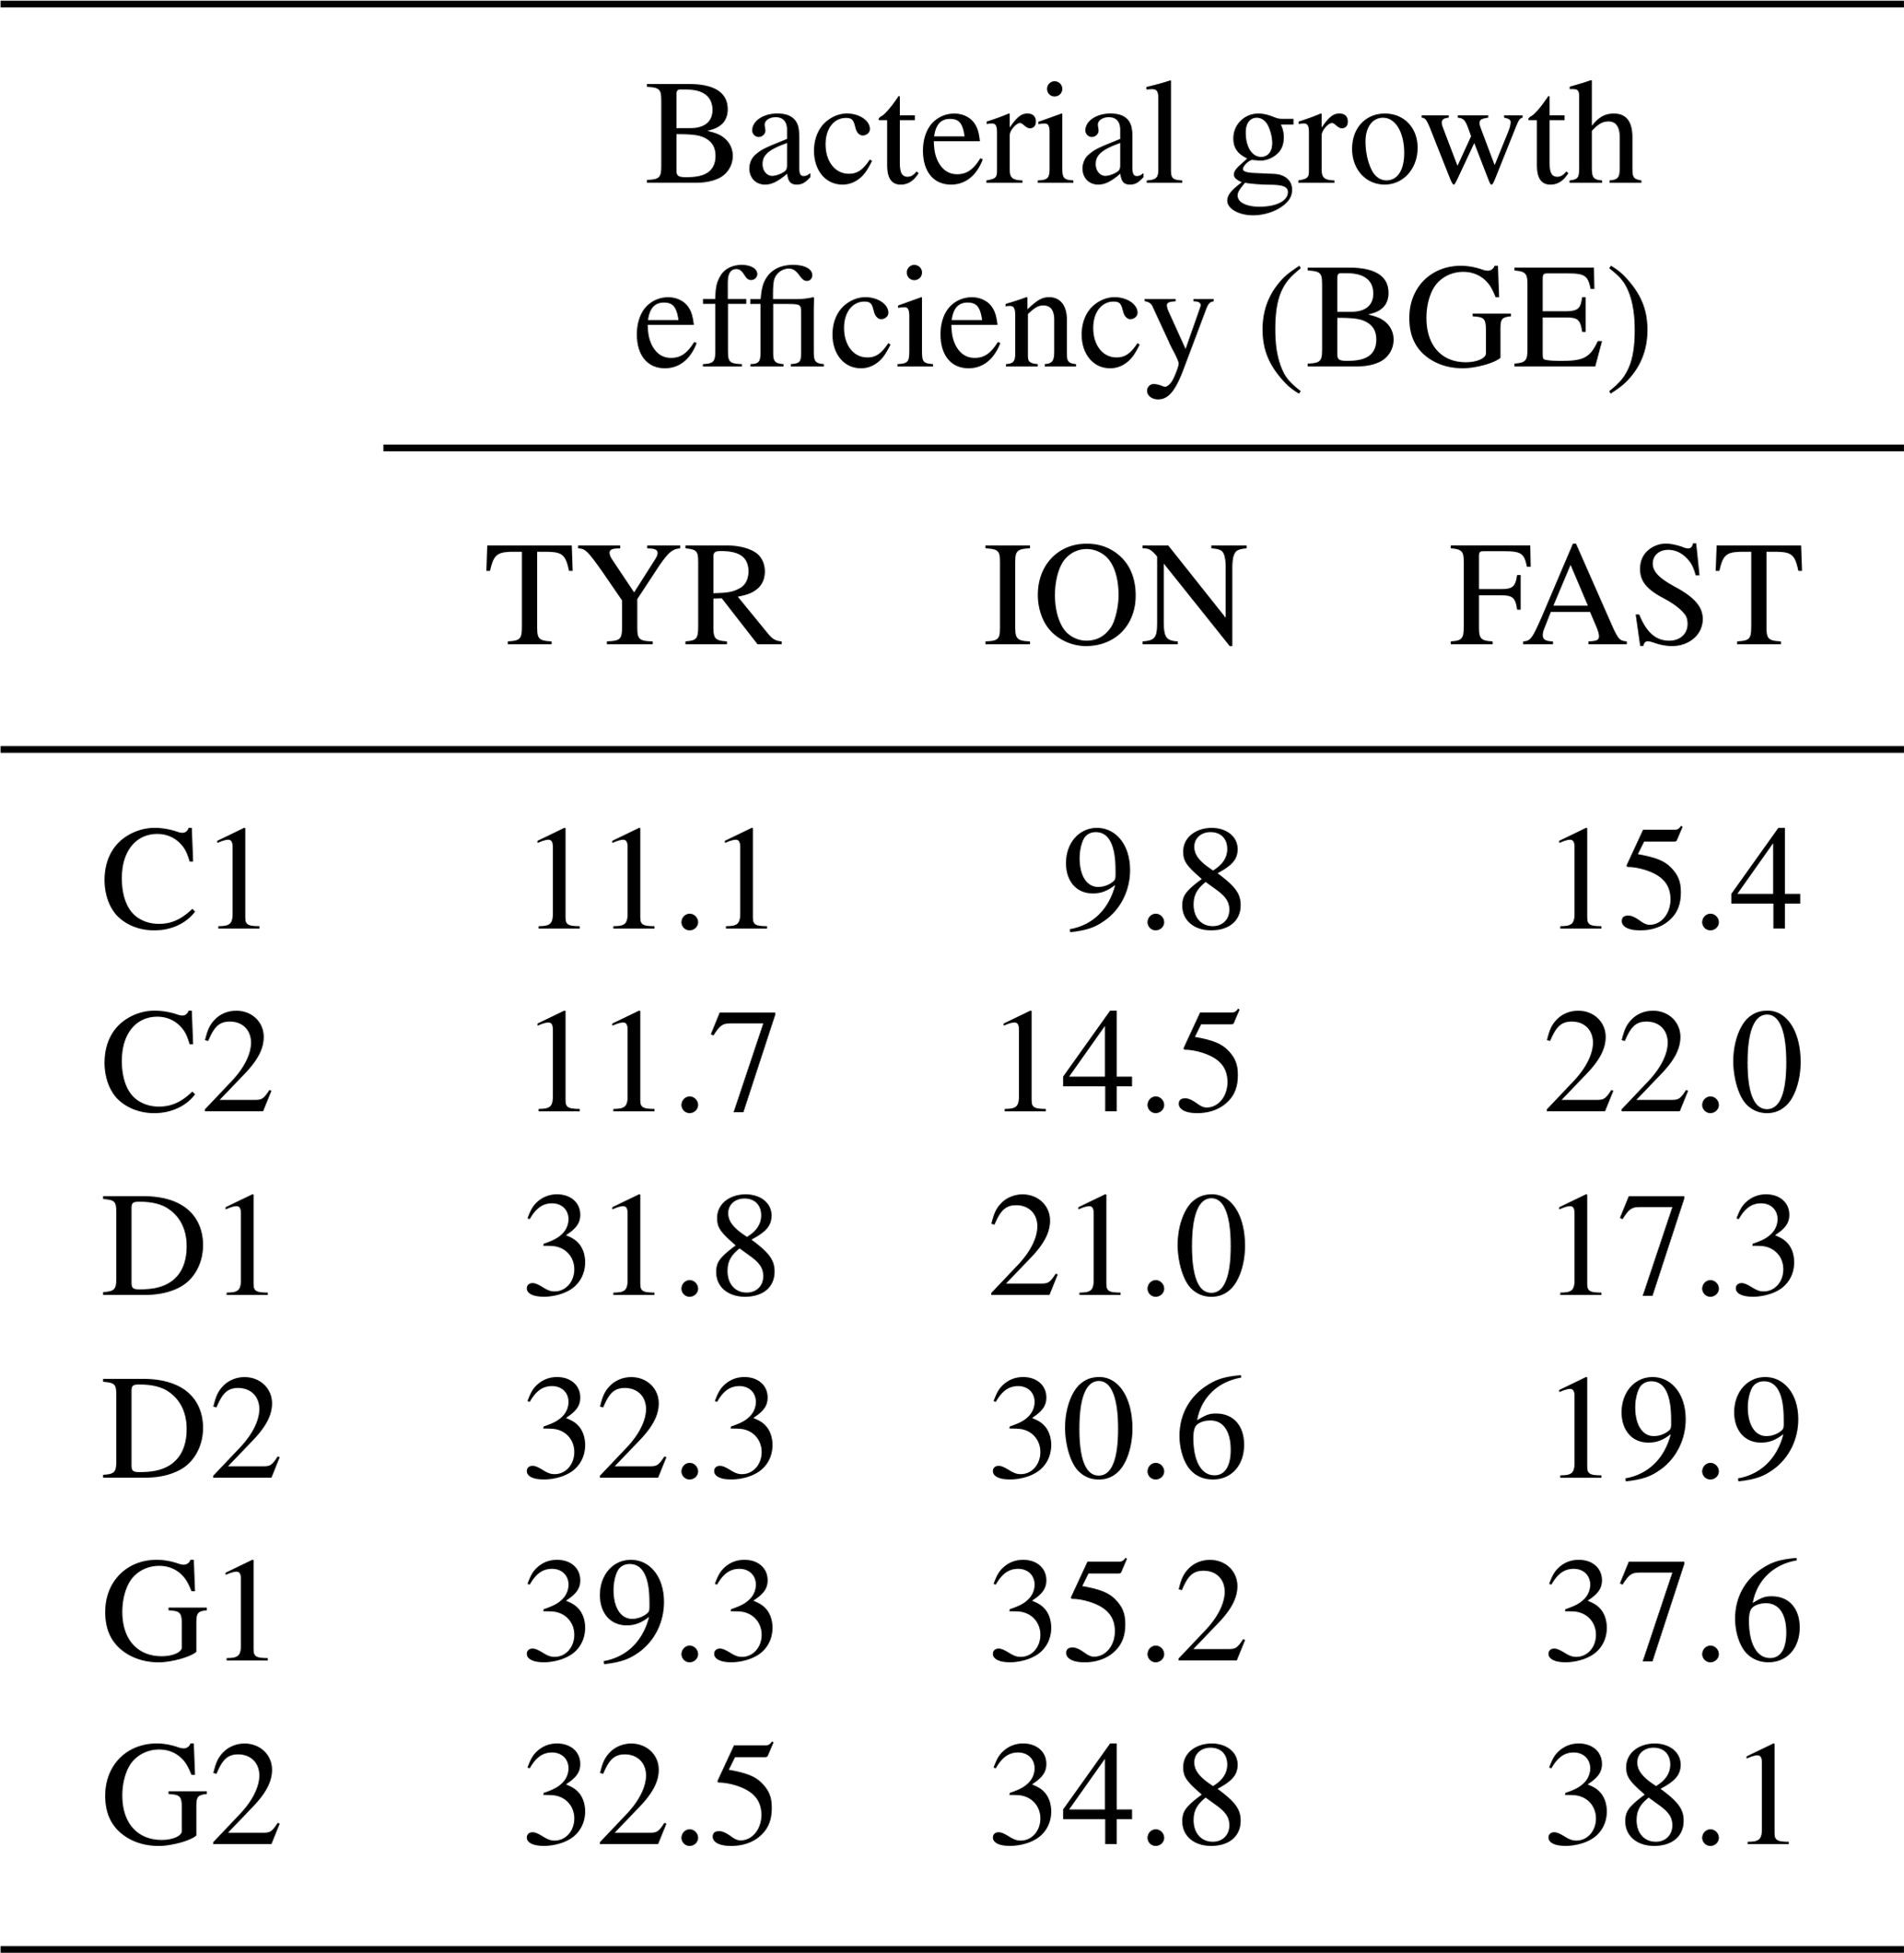
BGE increased in dust-amended tanks under present environmental conditions (treatment D) at TYR and ION, while no changes were detectable at station FAST due to a strong discrepancy between control duplicates and overall higher BGE at this station in the controls (Table 3). In contrast, warming and acidification exerted the strongest effect at station FAST with a doubling of BGE between treatment G and D. Although an increase in BGE was also observed at the two other stations in treatment G as compared to present environmental conditions (treatment D), this increase was more limited (ca. 1- to 1.4-fold increase).
The alkaline phosphatase Vm (AP Vm) increased in all experiments after dust seeding, with amplified effects in G treatments (Fig. S4 in the Supplement). Note that AP Vm also increased in the controls at TYR and FAST. In contrast, leucine aminopeptidase Vm (LAP Vm) showed a succession of peaks instead of a continuously increase (Fig. S4). It was higher in dust-only treatment (D) as compared to the controls at TYR and FAST. A larger variability between duplicates at ION prevents such an observation. At all stations, maximum velocities were measured under future environmental conditions (G). Vm being possibly influenced by enzyme synthesis but also by the number of cells inducing such enzymes, we also computed specific AP Vm per heterotrophic bacterial cell (Fig. 7). Specific AP Vm slightly increased during all experiments in controls and dust-amended tanks (D), with no visible differences between these treatments, and a clear over-expression of this enzyme was observed under warmer and more acidified conditions (treatment G) especially at station FAST where velocities were enhanced by a ∼8-fold at t96 h.
3.4 Inorganic and organic material export
Both total mass and organic matter fluxes, as measured from analyses of the sediment traps at the end of each experiment, were extremely low under control conditions (Fig. 8). Only less than 30 % of the dust introduced at the surface of the tanks were recovered at the end of the experiment (3 or 4 d after) in the sediment traps with . The composition of the exported material was quite similar for each experiment with no significant difference between D and G treatments with 3 %–5 % opal, 4 % organic matter, 35 %–36 % CaCO3 and 48 %–54 % lithogenic matter (Fig. S5 in the Supplement). Additions of dust in tanks D and G led to a strong increase in both fluxes with a large variability between the duplicates of treatment D at ION. No clear changes between tanks maintained under present and future conditions of temperature and pH could be highlighted.
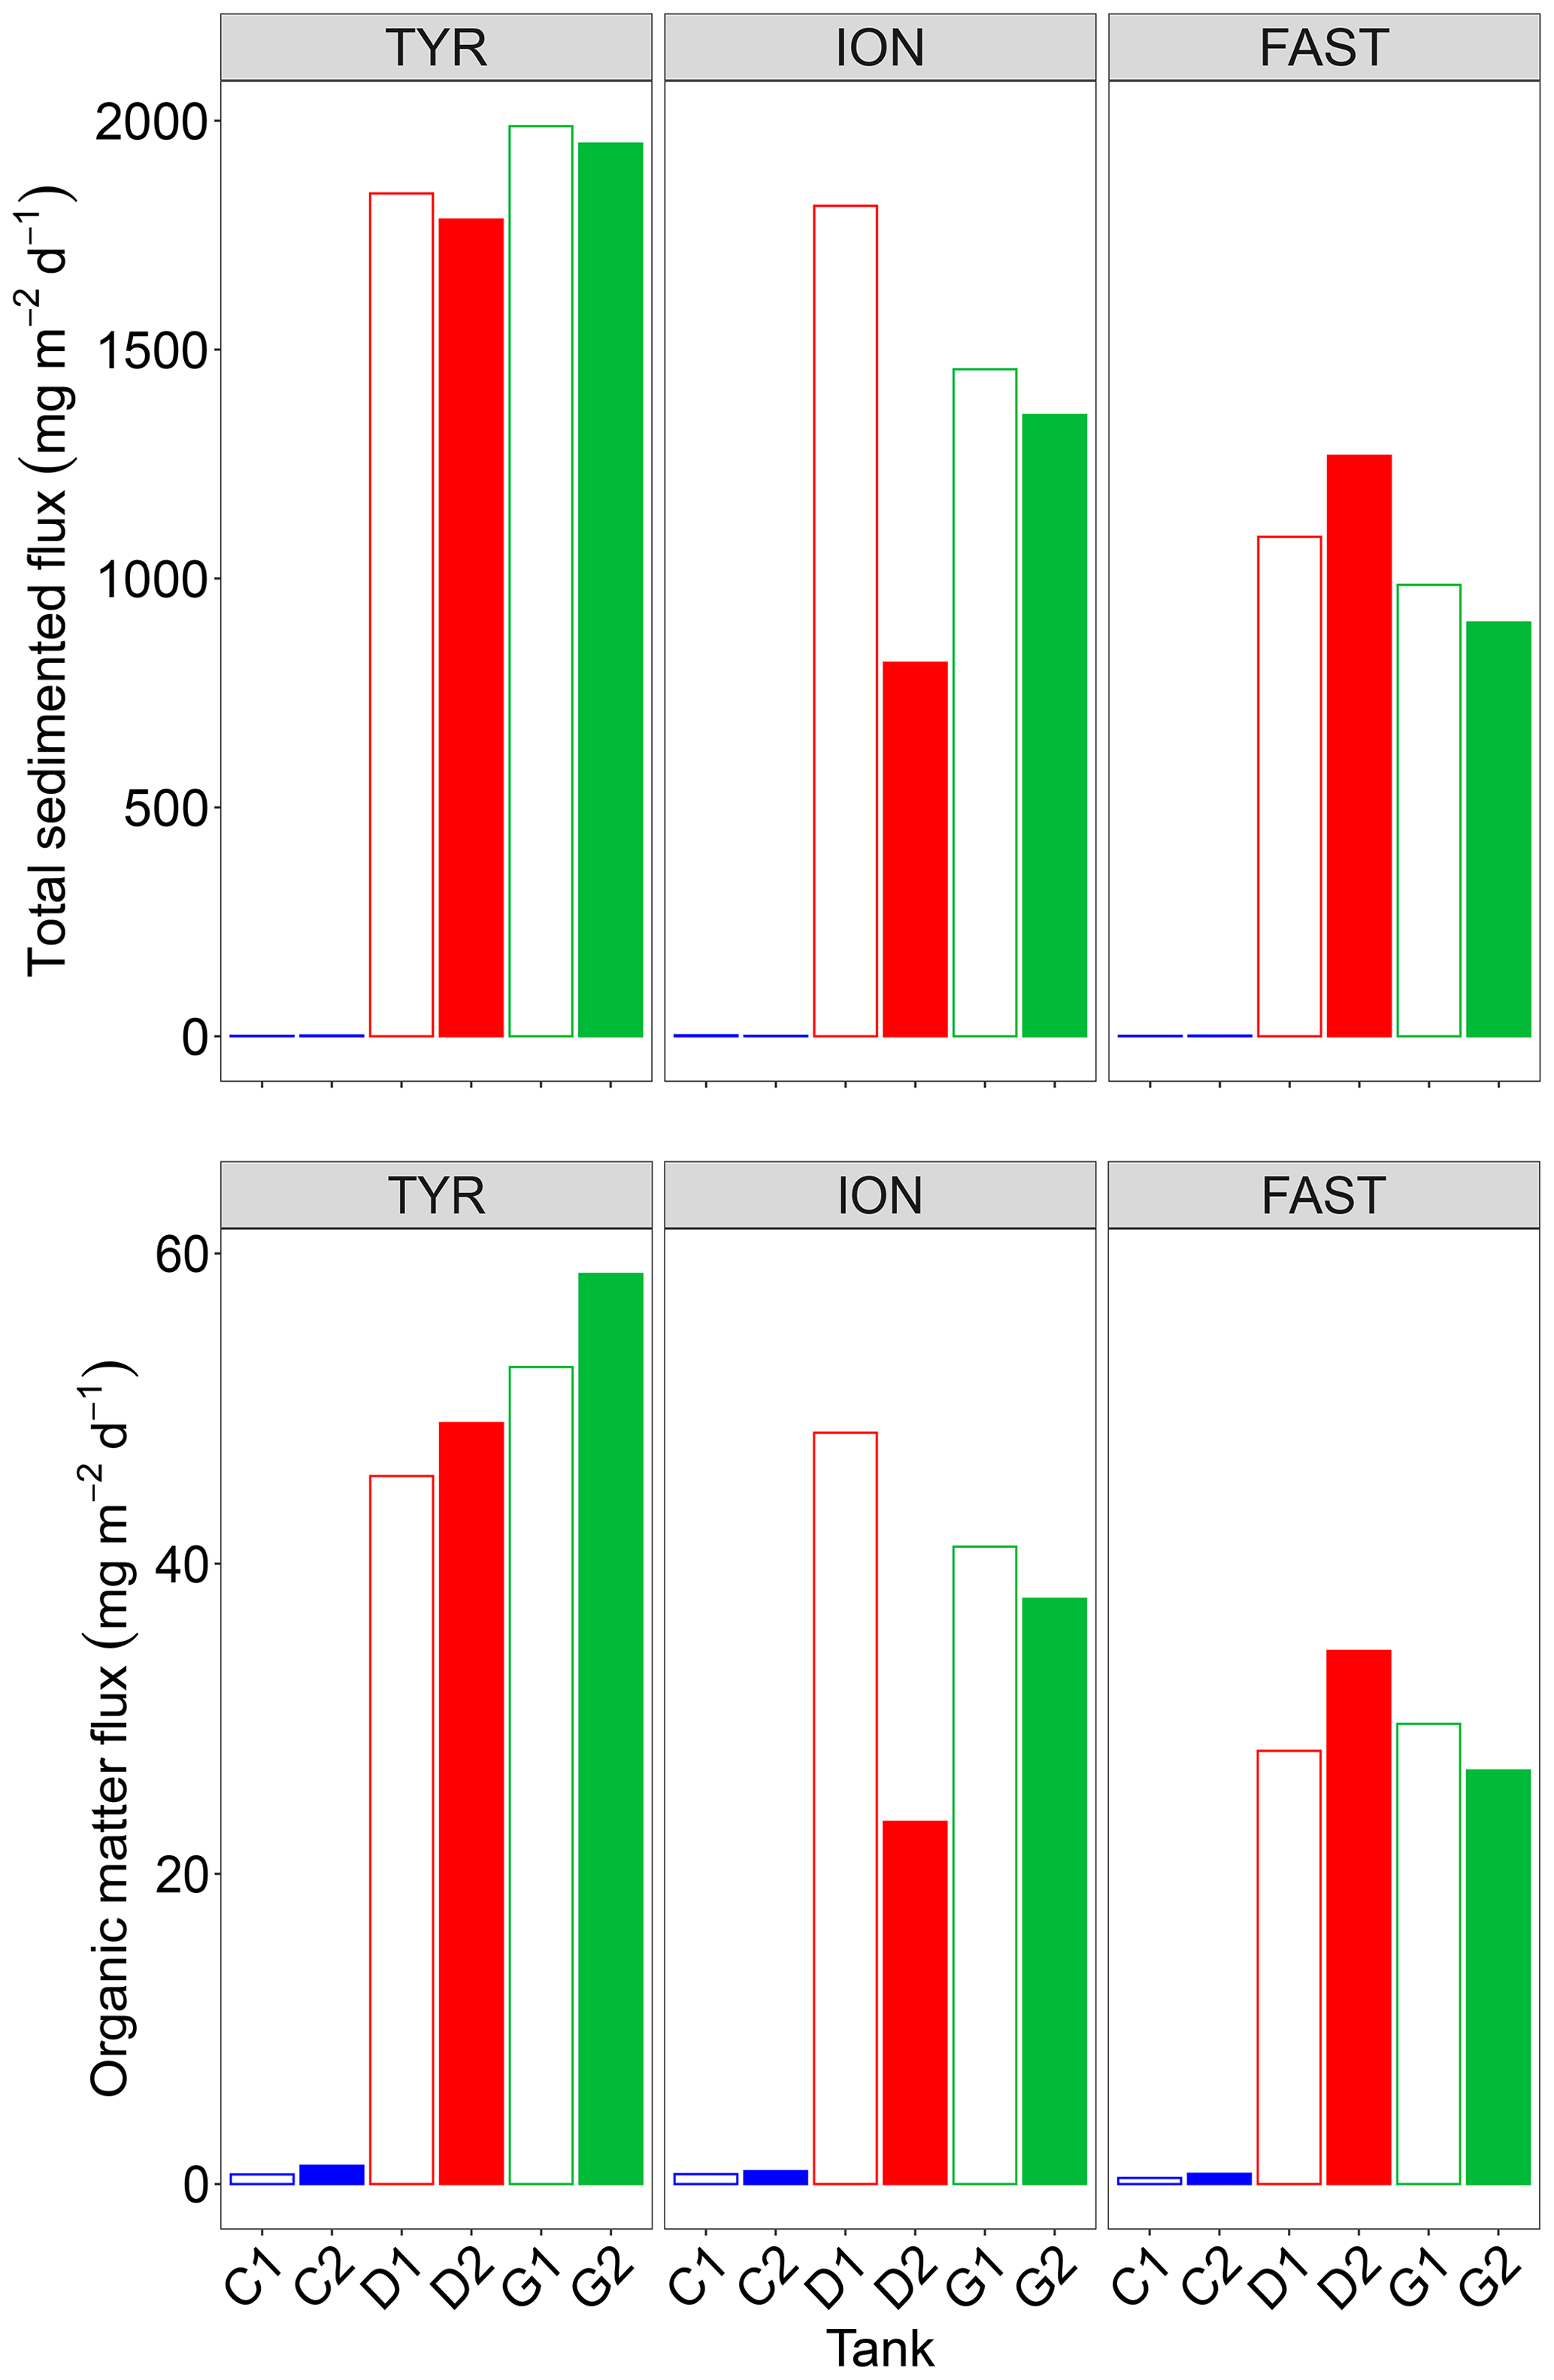
Figure 8Total mass and organic matter fluxes measured in the sediment traps at the end of the three experiments (TYR, ION and FAST) in the six tanks (C1, C2, D1, D2, G1 and G2).
4.1 Initial conditions of the tested waters and evolution in controls
As discussed in detail in the companion paper from Gazeau et al. (2021), the three sampling stations were typical of stratified (mixed layer depth of 10–20 m) oligotrophic conditions encountered in the open Mediterranean Sea in late spring–early summer. Briefly, the low NOx:DIP ratio nutrient concentrations suggest that communities found at the three stations experienced N and P co-limitation at the start of the experiments. The composition of the smaller-size phytoplankton communities differed substantially, with autotrophic nano-eukaryotes dominating at stations TYR and ION and a larger contribution from autotrophic pico-eukaryotes and cyanobacteria at station FAST. The observed low total chlorophyll a concentrations and the small contribution of large phytoplankton cells at the start of the three experiments are characteristic of LNLC areas in general, and of surface Mediterranean waters in late spring and summer (Siokou-Frangou et al., 2010). DOC concentrations at the start of the experiments were in the same range (60–75 µmol C L−1) as those measured from samples collected in surface waters using clean sampling procedures (Van Wambeke et al., 2021), revealing no contamination issues from our sampling device. TAA concentrations as measured in the tanks at t0 were also consistent with measurements from surface water samples (Van Wambeke et al., 2021) with an average across stations and treatments of 254±36 nmol L−1 (Fig. S2 in the Supplement). In contrast, TCHO appeared higher at t0 (average across stations and treatments of 681±98 nmol L−1) than concentrations based on clean in situ sampling (average of 595±43 nmol L−1; Van Wambeke et al., 2021). The decrease in POC concentrations between pumping (t−12 h) and t0 for the three experiments, especially at station TYR (likely linked to higher initial concentrations), was likely a consequence of sedimentation of senescent cells and/or fecal pellets in our experimental systems, which are designed to evaluate the export of matter thanks to their conical shape. TEP concentrations were not quantified at t−12 h and therefore there is no possibility to evaluate if sedimentation of these particles occurred before t0 in our tanks. At t0, larger and more abundant TEPs were measured at station TYR compared to the two other stations (data not shown).
As a consequence of a very low availability of inorganic nutrients, TChl a and 14C-based production rates were very low, all typical of oligotrophic conditions. Nano- and micro-phytoplanktonic cells (>2 µm) contributed most of the 14C-based particulate production (∼80 %), as found also on several on-deck incubations at the three stations (on average 73±6 %; Marañón et al., 2021). %PER values were also very similar to those measured during these on-deck incubations (∼40 %–45 %; see Marañón et al., 2021). This suggests there was no significant impact of our experimental protocol on rates and partitioning of 14C-based production rates (i.e., sampling from the continuous seawater supply, delay of 12 h before initial measurements, artificial light etc.). The low values of chlorophyll stocks as well as of 14C-based production rates are consistent with previous estimates based on direct measurements, satellite observations and modeling approaches in the same areas in late spring–early summer (e.g., Bosc et al., 2004; Lazzari et al., 2016; Moutin and Raimbault, 2002).
The metabolic balance was in favor of net heterotrophy at all stations at the start of the experiments (NCP<0). Net heterotrophy in the open Mediterranean Sea at this period of the year has been reported by Regaudie-de-Gioux et al. (2009) and Christaki et al. (2011) in agreement with our measurements at t0 in control tanks (Table 1). The lowest NCP and the highest CR rates were measured at station TYR, suggesting that the autotrophic plankton community was not very active at this station. This was confirmed by the 14C-based particulate production rates, which were about half those measured at the other two stations. The community at TYR was most likely relying on regenerated nutrients, as shown by the highest levels of ammonium () measured at the start of this experiment (Gazeau et al., 2021). As discussed in Guieu et al. (2020b), a dust deposition event took place several days before the arrival of the vessel in this area, likely on 10–12 May. This dust event was confirmed by inventory of particulate aluminum in the water column at several stations of the Tyrrhenian Sea including TYR, 6 to 9 d after the event (Bressac et al., 2021). This dust deposition likely stimulated phytoplankton growth and POC accumulation shortly after the deposition and consequently increased the abundance of herbivorous grazers (copepods) and attracted carnivorous species (Feliú et al., 2020), subsequently driving the community towards a net heterotrophic state that characterized the initial condition of the experiment at this station. The favorable conditions for BP growth at TYR were also confirmed by the highest μBP growth rates obtained among the three experiments (Table 2; 0.06–0.07 h−1) in controls tanks.
The two other stations, although both also showing a slight net heterotrophic state, were clearly different from each other in terms of initial biological stocks and metabolic rates. Indeed, whereas TChl a and abundances of pico- and nano-autotrophic cells (flow cytometry counts; Gazeau et al., 2021) were higher at FAST compared to ION, the autotrophic community was not more efficient at fixing carbon at FAST, as shown by similar initial 14C-based production rates. In contrast, both heterotrophic prokaryotic abundances and BP were much higher at station FAST as compared to ION, leading to initial higher CR and lower NCP. At ION, the initial NCP closer to metabolic balance further suggests a tight coupling between heterotrophic prokaryotes and phytoplankton at this station, as discussed by Dinasquet et al. (2021).
For most of the chemical and biological stocks (e.g., nutrients, pigments) presented in Gazeau et al. (2021), no major changes took place during the three experiments under control conditions. Here, we further show that DOC, POC and TEP concentrations did not exhibit strong changes during the experiments. For DOC, large variability between the duplicates (C1 and C2) potentially masked an increase towards the end of the experiments. The same holds true for autotrophic metabolic rates, as 14C-based particulate production rates showed no marked variations during the three experiments, although a slight increase was visible at FAST until t48 h. The communities at the three stations remained heterotrophic under the nutrient-limited conditions in the controls. However, heterotrophic prokaryotes probably benefited from initial inputs of available organic matter issued from other stressed eukaryotic organisms and/or POC decay between t−12 h and t0, which could be due to both sedimentation and degradation. This was reflected in the progressive increase in BP, their variable initial growth rates (μBP ranged from 0.02 to 0.06 h−1 in control tanks according to the experiment) as well as increasing TAADOC ratios at the three stations. Finally, an initial increase in BP during incubations is generally described and classically attributed to a bottle effect, which favors large, fast-growing bacteria and often induces mortality of some phytoplankton cells (Calvo-Díaz et al., 2011; Ferguson et al., 1984; Zobell and Anderson, 1936).
4.2 Impact of dust addition under present environmental conditions
The addition of nitrogen and phosphorus in the experimental tanks through dust seeding (+11 to +11.6 µmol L−1 and +22 to +30.8 nmol L−1 for NOx and DIP, respectively, in dust enriched, i.e., D1 and D2, versus controls; Gazeau et al., 2021) had very contrasting impacts on the metabolism of the communities, depending on the station. At TYR, surprisingly, the relieving of nutrient (N, P) limitation had a negative impact on 13C incorporation as well as on both particulate and dissolved 14C-based production rates (as seen by the relative changes compared to the control presented in Fig. 9). These observations are fully corroborated by the observed relative decrease in GPP in these tanks (D1 and D2) relative to controls and by the negative impact of dust-addition on TChl a concentrations as discussed by Gazeau et al. (2021). Integrated 14C-incorporation rates converted to P (using a C:P molar ratio of 245:1 determined in the particulate organic matter in surface waters of the northwestern Mediterranean Sea during stratification; Tanaka et al., 2011) showed that phytoplankton P requirements in treatment D (∼2 nmol P L−1) were much lower than the release of DIP through dust addition at station TYR (+20.4 to +24.6 nmol P L−1; Gazeau et al., 2021). This suggests that the observed strong decrease in DIP at TYR following dust addition was due to a utilization by the heterotrophic compartment. Indeed, in contrast to the autotrophic compartment, both heterotrophic prokaryotic abundances (Gazeau et al., 2021) and BP (this study, Fig. 9) showed that heterotrophic prokaryotes reacted quickly and strongly to the increase in DIP availability. Integrated BP increased by almost 400 % in tanks D1 and D2 as compared to controls (Fig. 9). Such relative increases in BP, surpassing by far the observed relative increases in CR, suggest a much more efficient utilization of resources by heterotrophic prokaryotes in this treatment (i.e., BGE increased by 200 % as compared to the controls; Fig. 9). As such, at TYR, the addition of dust drove the community to an even more heterotrophic state. Such an absence of response of the autotrophic community despite the input of new N and P from simulated wet deposition was never observed in dust enrichment experiments performed in the Mediterranean Sea (Guieu and Ridame, 2020). To the best of our knowledge, it is the first time that a negative effect of dust addition is experimentally demonstrated on the metabolic balance. The apparent utilization of nutrients, especially DIP (Gazeau et al., 2021), by heterotrophic prokaryotes was extremely fast, starting right after dust addition and driving DIP concentrations back to control levels at the end of the experiment (t72 h). While heterotrophic prokaryotic abundances increased until the end of the experiment, BP rates increased exponentially during the first 24 h, and then BP reached a plateau. Heterotrophic prokaryotes appeared limited by nutritive resources although DIP concentrations were not yet back to their initial level and no relative increase in the AP Vm per cell compared to the control was observed in these tanks. Independent nutrient experiments showed a direct stimulation of BP in the dark after addition of DIP (Van Wambeke et al., 2021), suggesting a great competition with phytoplankton for DIP utilization at TYR. After 24 h, abundances of heterotrophic prokaryotes continued to increase while BP stabilized, suggesting a lesser extent of lysis and viral control than in the other experiments (abundances of heterotrophic nanoflagellates decreased; Dinasquet et al., 2021). This limitation of BP was potentially a consequence of relatively less available access to labile DOC sources, as 14C-based production rates decreased relative to the controls at t24 h and t48 h although BP increased by 200 %–800 %. The very tight coupling between phytoplankton and bacteria at all stations investigated was further confirmed by the absence of an important 13C incorporation into DOC (Fig. S3).
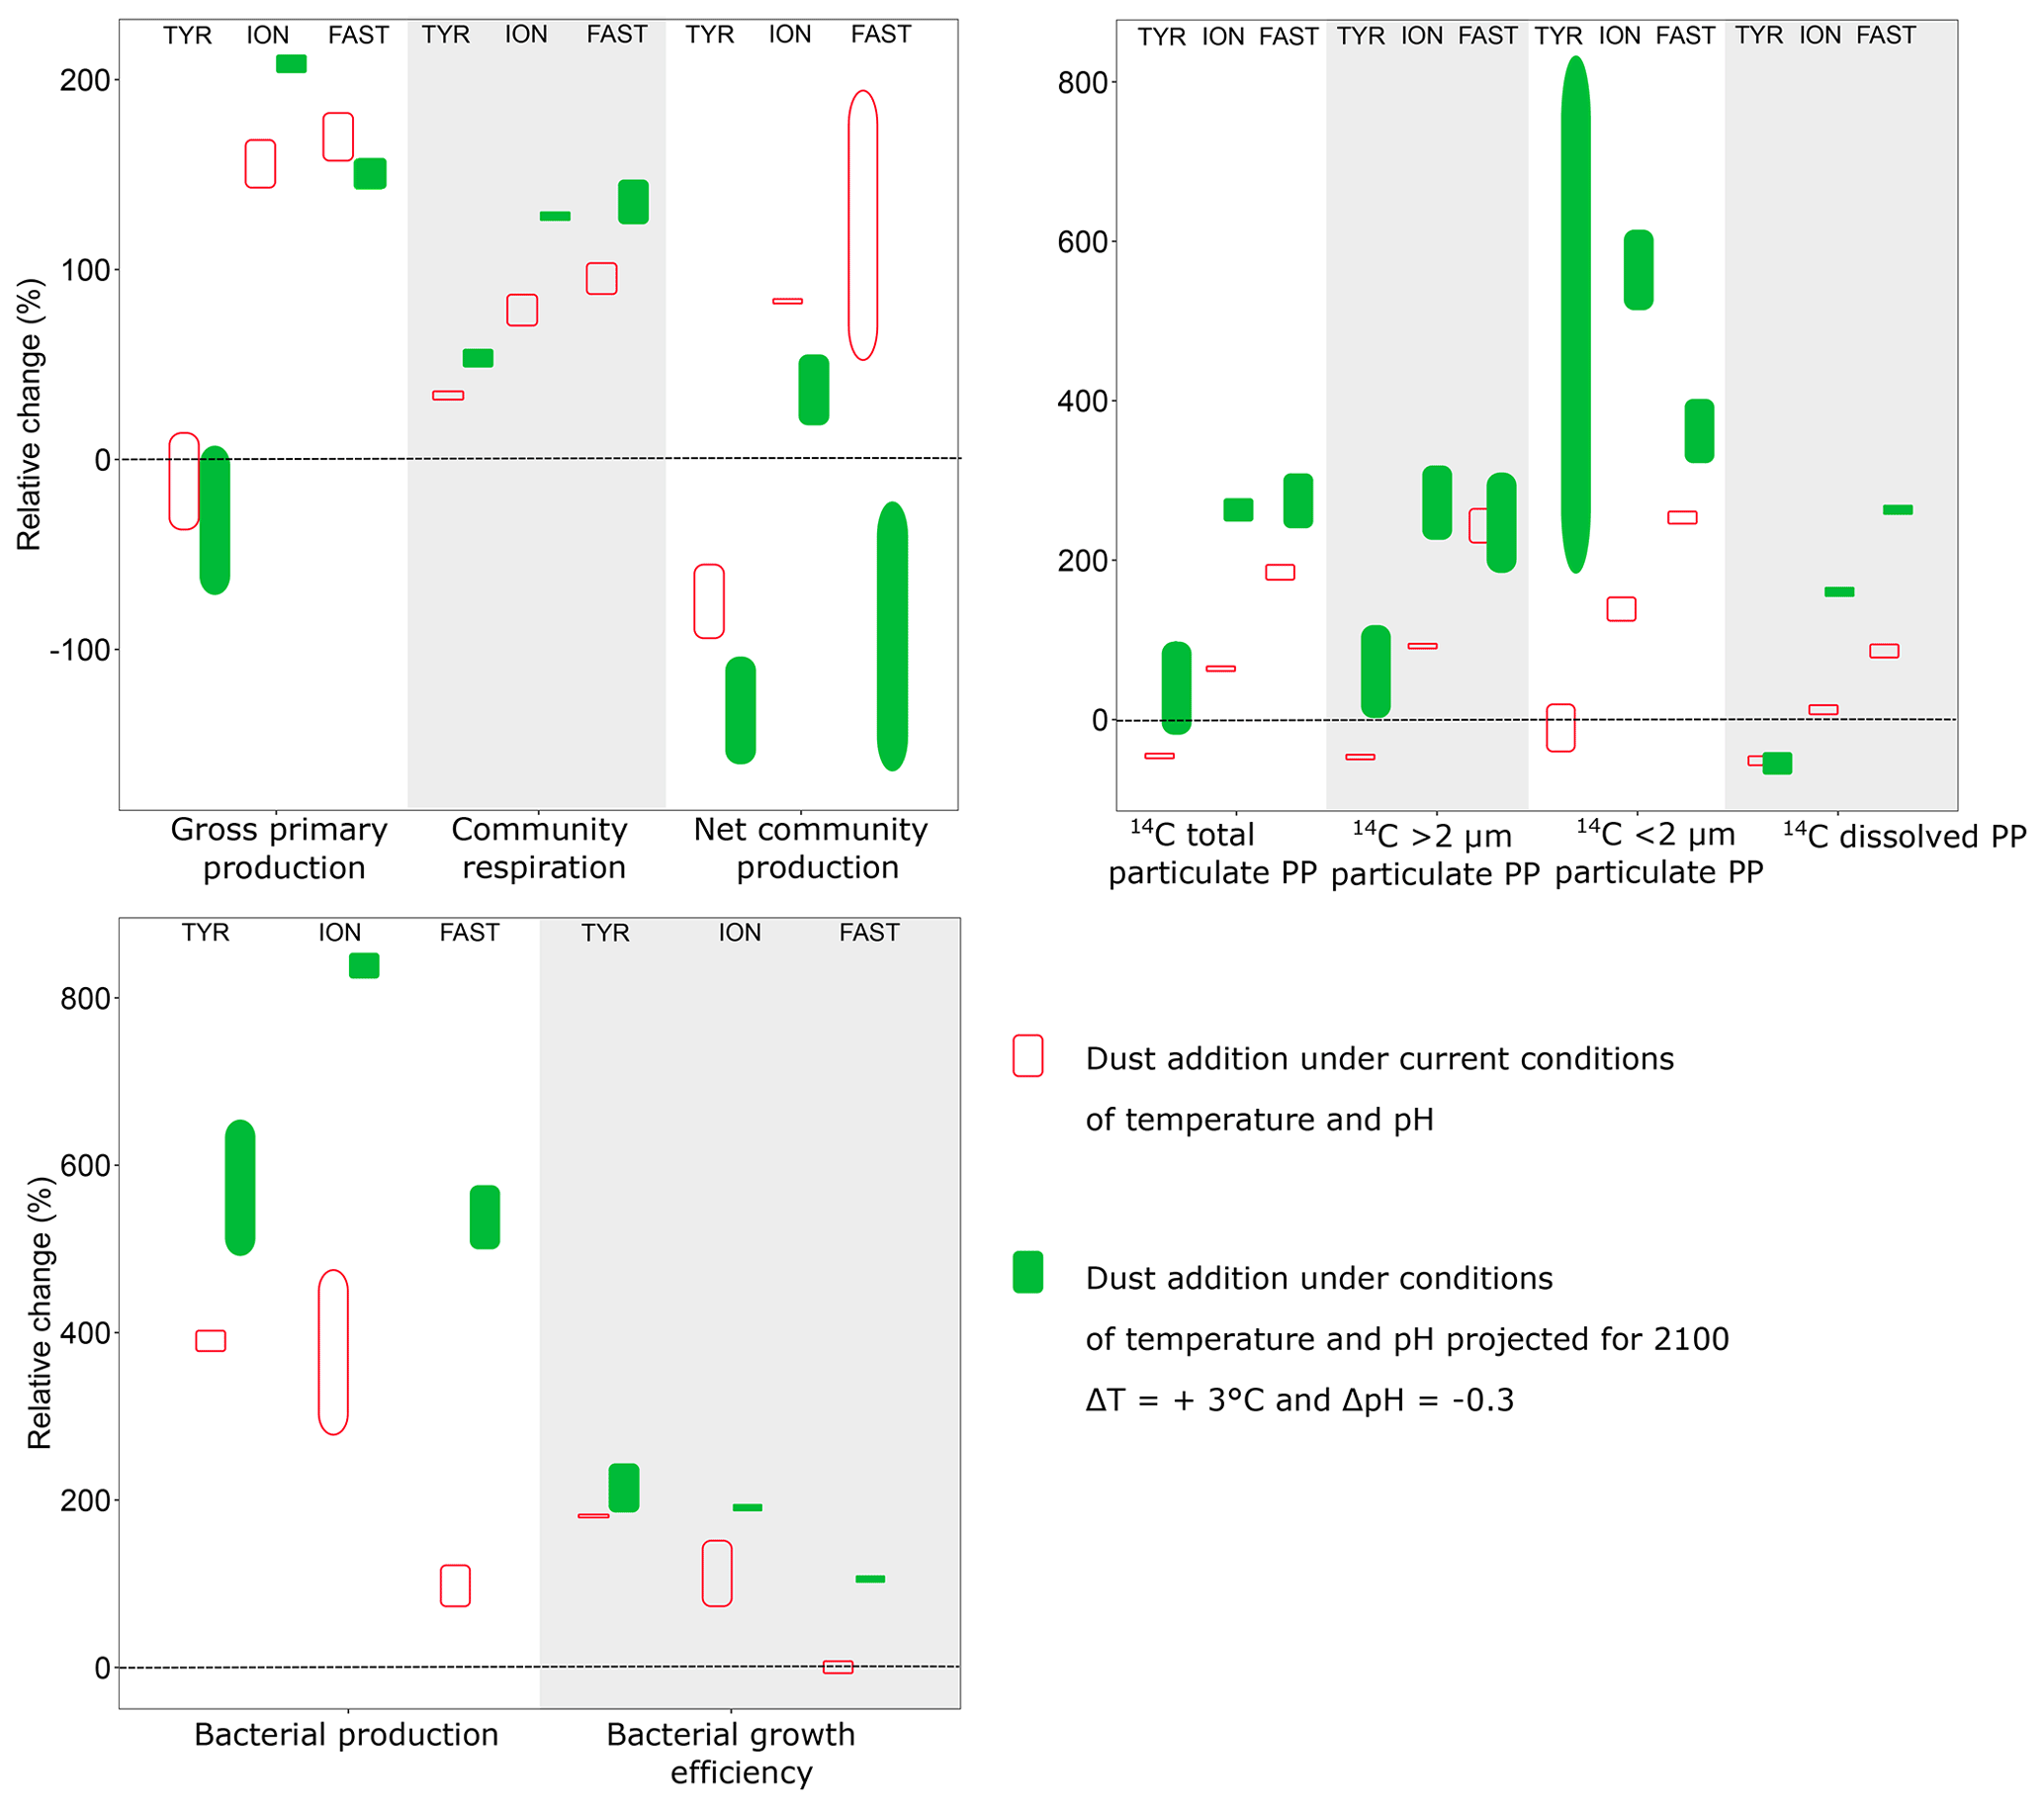
Figure 9Relative difference (%) between integrated rates measured in tanks D (D1, D2; dust addition under present conditions of temperature and pH) and G (G1, G2; dust addition under future conditions of temperature and pH) as compared to the controls (C1, C2) during the three experiments (TYR, ION and FAST). Vertical boxes represent the range observed between the two replicates per treatment.
At stations ION and FAST, in contrast to TYR, both the autotrophic and heterotrophic community benefited from dust addition relative to the controls (Fig. 9). Interestingly, while the relative increase in integrated autotrophic processes (GPP and all 14C-based production rates) was more important at FAST than at ION, the opposite was observed for BP. Estimated BGE values even suggest an absence of response to dust addition at station FAST compared to the controls. The different (relative) responses of BP at the two stations could be partly explained by the dynamics of BP in the control tanks as no clear pattern could be observed at ION while a continuous increase was observed at FAST. As shown by Gazeau et al. (2021), at FAST, abundances of heterotrophic prokaryotes were much higher at the start of the experiment, further increased until t48 h and then declined until the end of the experiment.
We can rule out a potential limitation of BP from DIP availability at station FAST as DIP levels remained much higher in tanks D than in the controls (Gazeau et al., 2021). Furthermore, the amount of maximum DIP reached before its decline compared to TYR and ION showed a less important direct DIP uptake, suggesting that communities were not as much P limited at FAST compared to the other stations at the start of the experiment. Finally, no increase in specific AP Vm was observed in these tanks as compared to the controls (Fig. 7), suggesting no particular additional needs for AP synthesis per unit cell following dust addition. A potential explanation resides in the competition between heterotrophic bacteria and phytoplankton for DIP utilization. At station ION, P requirements of the autotrophic community were low compared to the initial input of DIP following dust seeding (∼9 nmol P L−1 as compared to an input of +22 to +23.3 nmol P L−1; Gazeau et al., 2021). In contrast, at FAST, the autotrophic community consumed a much larger proportion of the initial DIP input (∼25 nmol P L−1 as compared to an input of 30.8–31.3 nmol P L−1) and phytoplankton appeared as a winner for the utilization of DIP towards the end of the experiment at this station. It seems that heterotrophic bacteria and phytoplankton were more in balance and less stressed at the start of the experiment at FAST; i.e., phytoplankton abundances showed no decrease between t−12 h and t0 and BP did not increase as much as during the other two experiments, suggesting a strong predation pressure (μBP was the lowest of the three experiments: ca. 0.02 h−1 in the controls).
The explanation for the observed differential responses of the autotrophic community at the two stations (FAST>ION) is not evident and further complicated by the fact that the sampling strategy differed between the two stations (i.e., no sampling at t72 h, replaced by a sampling at t96 h). It is, however, unlikely that this different sampling strategy was responsible for the different changes in computed integrated autotrophic rates at the two stations. As a maximal increase in nano-eukaryote abundance was observed at t72 h at FAST (followed by a drastic reduction at t96 h; Gazeau et al., 2021), excluding this sampling point in the calculation of autotrophic metabolic rates would most likely have led to an underestimation of these rates rather than an overestimation. Furthermore, a similar partitioning of 14C-based production rates throughout the two experiments did not provide clear insights into which size group benefited the most at station FAST compared to ION. Two non-exclusive explanations could be proposed: (1) as mentioned above, a less important immediate consumption of DIP by heterotrophic bacteria leading to a higher availability of new DIP for phytoplankton growth at FAST (+31 vs. +22 to +23 nmol L−1 at FAST and ION, respectively; Gazeau et al., 2021) along with (2) the presence of a potentially more active community at the start of the experiment at FAST with a much higher contribution from smaller cells (i.e., pico-eukaryotes, Synechococcus; Gazeau et al., 2021) that are well known to be better competitors for new nutrients (e.g., Moutin et al., 2002) and that were less stressed at the start of the experiments.
During both experiments at ION and FAST, communities switched from net heterotrophy to net autotrophy between 48 and 72 h following dust addition (Fig. 6), leading to a positive integrated NCP at both stations (Fig. 9). This is an important observation since, to the best of our knowledge, the present study constitutes the first investigation of the community metabolism response to dust addition. However, it is important to discuss the timing of such a switch in community metabolism. Since heterotrophic prokaryotes reacted faster than autotrophs to the relief of nutrient (N, P) limitation (i.e., BP already increased by 150 %–500 % at t24 h, while 14C-based production rates increased only after 48–72 h), NCP was first lower (and negative) in the dust-amended tanks as compared to the controls. Marañón et al. (2010) and Pulido-Villena (2008, 2014) have already reported on a much faster response of the heterotrophic prokaryote community to dust enrichment in the central Atlantic Ocean and Mediterranean Sea, respectively. As DIP concentrations at the completion of their 48 h incubations did not differ from those in the controls, it is unlikely that primary production rates and consequently NCP would have further increased. In contrast, during our experiments, DIP concentrations in dust-amended tanks (D) reached initial levels only after 72 h at TYR and ION and remained far above ambient levels at FAST until the end of the experiment (t96 h). During the PEACETIME cruise, high-frequency sampling of CTD (conductivity, temperature, depth) casts allowed the evolution of biogeochemical properties and fluxes to be followed before and after wet dust deposition that took place in the area around FAST on 3–5 June (Van Wambeke et al., 2020). As in our experiment, a rapid increase in BP was responsible for the observed in situ decline in DIP concentrations in the mixed layer following the rain with no detectable changes in primary production (Van Wambeke et al., 2020). The intensity of the wet deposition event that was simulated during our experiments was, by far, higher, but still representative of a realistic scenario (Bonnet and Guieu, 2006; Loÿe-Pilot and Martin, 1996; Ternon et al., 2010).
The most intriguing result concerning the export of inorganic and organic matter is that these fluxes were maximal at the end of the experiment at TYR in the dust-amended tanks despite the fact that 14C-based production was relatively low and not enhanced by dust addition. Based on previous studies (Bressac et al., 2014; Louis et al., 2017; Ternon et al., 2010), organic matter export was most likely mainly due to the formation of organic-mineral aggregates triggered by the introduced lithogenic particles (referred thereafter to as POClitho). Indeed, Louis et al. (2017) showed that such an aggregation process occurs within 1 h after dust deposition. These authors further demonstrated the key role of TEPs as the conversion of dissolved organic matter (DOM) to POC was mediated by TEP formation/aggregation activated by the introduction of dust. As TEP concentrations were only measured on two occasions after seeding, with the first measurement occurring at t24 h, the dynamics of these particles cannot be studied in detail. Nevertheless, it is very likely that the sharp decrease in TEP-C (Fig. 3) between t24 h and t72 h was related to POClitho export. The coefficient linking POClitho to Lithoflux (i.e., the mass of sedimented particles) measured here (0.02) is consistent with values reported for other experiments conducted in the Mediterranean Sea (Louis et al., 2017).
Even though 14C-based production rates were enhanced in the dust-amended tanks at stations ION and FAST, the amount of POC exported at the end of these experiments remained lower than at TYR, with fluxes ∼10–20 .
The recovery of the introduced dust (traced by the lithogenic mass recovered in the traps) was low (27 % at TYR, ∼20 % at ION and 13 %–19 % at FAST) reflecting that a majority of the dust particles (the smaller ones that are the most abundant according to the particle size distribution of the dust) still remained in the tanks after 3 or 4 d following dust addition. This has been already observed in pelagic mesocosms (Bressac et al., 2012) as those small particles can aggregate to organic matter and eventually sink. The higher export efficiency observed () is likely linked to the higher initial abundance and higher production of TEPs during the experiment (Fig. 3). At TYR, impacted by a strong dust event several days before the experiment started (see above), the likely stimulation of the autotrophs after this in situ event should have been followed by the production of a fresh and abundant DOM, comparable to the “post-bloom situation” in Bressac and Guieu (2013).
4.3 Impact of dust addition under future environmental conditions
Warming and/or acidification had a clear impact on most evaluated stocks and metabolic rates. Gazeau et al. (2021) have already discussed temperature- and pH-mediated changes in nutrient uptake rates and autotrophic community composition in these experiments. Briefly, they showed that warming and acidification did not have any detectable impact on the release of nutrients from atmospheric particles. Furthermore, these external drivers did not drastically modify the composition of the autotrophic assemblage, with all groups benefiting from warmer and acidified conditions. Here, we showed that the difference in the response of plankton community metabolism to dust addition under present and future conditions of temperature and pH was highly dependent on the sampling station (Fig. 9). At all stations, 14C-based particulate production rates were enhanced under future conditions as compared to those measured under present environmental conditions (treatment D), although this pattern was not observed for 13C incorporation into POC at stations ION and FAST. At ION, no differences could be detected and at FAST an even lower 13C enrichment was measured at the end of the experiment. These contrasting patterns between 14C-uptake rates and 13C enrichment of POC are likely explained by the fact that the latter covered the whole experimental period (including dark periods) and represents net community carbon production while 14C-based rates were measured over 8 h incubations in the light, providing an estimate in between gross and net carbon production.
Similarly, the heterotrophic compartment was more stimulated, as BP rates increased strongly at all stations under future conditions compared to treatment D. The relatively smaller increase in CR rates, compared to BP, leading to higher BGE suggests a better utilization of resources by heterotrophic prokaryotes under future environmental conditions. Overall, CR was more impacted than GPP, with the consequence that all integrated NCP rates decreased under future environmental conditions compared to present conditions (treatment D). At station TYR, as discussed previously, dust addition under present conditions did not lead to a switch from net heterotrophy to net autotrophy. This pattern was even more obvious under warmer/acidified conditions, with a larger decrease in integrated NCP at this station. The decrease in integrated NCP at station FAST relative to controls, as well as the smaller increase in all 14C-based production rates relative to those observed at station ION, must be taken with caution. As already discussed, the fact that for these processes (O2 metabolism and 14C incorporation) no samples were taken at FAST at t72 h when maximal cell abundances were recorded for all autotrophic groups (pico- and nano-eukaryotes, autotrophic bacteria) must have artificially led to an underestimation of these integrated metabolic rates. The question of the timing appeared even more preponderant under warmer/acidified conditions, especially at station FAST, where the very important increase in BP led to a full consumption of DIP before t48 h (Gazeau et al., 2021) and drove the community towards a strong heterotrophy. The metabolic balance further switched to a slight autotrophy at t72 h when heterotrophic bacterial activity appeared limited by nutrient availability.
Both elevated partial pressure of CO2 (pCO2) and warming are major global change stressors impacting marine communities. Elevated pCO2 may directly facilitate oceanic primary production through enhanced photosynthesis (Hein and Sand-Jensen, 1997; Riebesell et al., 2007), although the effects appear to be species- and even strain-specific (e.g., Langer et al., 2009). Warming affects organisms by enhancing their metabolic rates (Brown et al., 2004; Gillooly et al., 2001). Although recent studies suggest large differences in temperature sensitivity between phytoplankton taxa (Chen and Laws, 2017) and no significant overall difference between algae and protozoa (Wang et al., 2019), mineralization rates are usually believed to be more impacted by warming than primary production rates, potentially leading to a decline in net oceanic carbon fixation (Boscolo-Galazzo et al., 2018; Garcia-Corral et al., 2017; Lopez-Urrutia and Moran, 2007; Regaudie-de-Gioux and Duarte, 2012) and carbon export efficiency (Cael et al., 2017; Cael and Follows, 2016). Overall, our experimental setup did not allow warming to be discriminated from acidification effects, precluding an evaluation of their potential individual impacts. Nevertheless, we could speculate to which extent a 3 ∘C warming and a doubling of CO2 can explain some of the observed differences between D and G (for instance, a 2-fold increase in 14C-based production rates at ION). For photosynthesis, meta-analysis studies indicate minor effects of pCO2 on most investigated species (Kroeker et al., 2013; Mackey et al., 2015). Recent studies show a strong, although species-dependent, temperature sensitivity of phytoplankton growth (Chen and Laws, 2017; Wang et al., 2019), suggesting that a 3 ∘C warming could explain most of the increased carbon fixation in G compared to D. With respect to NCP, our results are in line with the general view and suggest a weakening of the so-called fertilization effect of atmospheric deposition in the coming decades.
In contrast, we did not observe an additional impact of future environmental conditions on the export of organic matter after dust addition as, at each station, this export was of the same order of magnitude for treatments D and G. This result is in agreement with the findings of a similar experiment in coastal Mediterranean waters that considered only pH change (Louis et al., 2017) but stands in contrast with the findings of Müren et al. (2005), who showed a clear decrease in sedimentation following a 5 ∘C warming in the Baltic Sea. Only a few studies have addressed the combined effect of both temperature and pH changes on aggregation processes and export but none considered dust as the particulate phase. These studies, focused mainly on the formation of TEPs, were inconclusive on the impact of these combined factors (Passow and Carlson, 2012, and references therein). The potential effect of warming and acidification on biogenic carbon export was certainly, over the rather restricted duration of the experiments, insignificant as compared to the large amount of carbon exported through the lithogenic pump. Although a longer experimental period would likely be necessary to clearly support an impact of future conditions on export, those changes occur on a long timescale that cannot be easily mimicked by experimental approaches. Only in situ co-located observations (atmospheric flux and export in sediment traps) over long temporal scales would be necessary to ascertain the interactive effects of these stressors at the decadal timescale.
Although the three experiments were conducted under rather similar conditions in terms of nutrient availability and chlorophyll stock of the tested seawater, contrasting responses were observed following the simulation of a wet dust deposition event. Under present conditions of temperature and pH, at the site where the community was the most heterotrophic (TYR), no positive impact of new nutrients could be observed on autotrophs, while a fast and strong response of heterotrophic bacteria drove the metabolic balance towards an even more heterotrophic state. The situation was different at the two other stations where a more active autotrophic community responded quickly to the relief in nutrient (N, P) limitation, driving the community to an autotrophic state at the end of these experiments. In all tested waters, an overall faster response of the heterotrophic prokaryote community, as compared to the autotrophic community, was observed after new nutrients were released from dust. Phytoplankton could benefit from nutrient inputs, only if the amount released from dust was enough to sustain both the fast bacterial demand and the delayed one of phytoplankton. As our experimental protocol consisted of simulating a strong, although realistic, wet dust deposition, further work should explore at which flux a wet dust deposition triggers an enhancement of net community production and therefore increases the capacity of the surface oligotrophic ocean to sequester atmospheric CO2. This question, of the utmost importance in particular for modeling purposes, should be answered through future experiments similar to the ones considered in our study but following a gradient approach of dust fluxes. As a consequence of a stronger sensitivity of heterotrophic prokaryotes to temperature and/or pH, the ongoing warming and acidification of the surface ocean will result in a decrease in the dust fertilization of phytoplankton in the coming decades and a weakening of the atmospheric CO2 sequestration capacity of the surface oligotrophic ocean. The contrasting results obtained at the three stations during our study will need to be translated into process parameterization. The important dataset presented in this paper, covering a variety of tested waters, environmental stressors and responses, will allow such a parameterization to be used in biogeochemical models coupled to ocean dynamics in order to depict the spatial and temporal dynamics of stocks and fluxes following dust deposition in surface oligotrophic waters.
Underlying research data are being used by researcher participants of the PEACETIME campaign to prepare other manuscripts, and therefore data are not publicly accessible at the time of publication. Data will be accessible (https://doi.org/10.17882/75747, Guieu et al., 2020b) once the special issue is completed (all papers should be published by fall 2021).
The supplement related to this article is available online at: https://doi.org/10.5194/bg-18-5423-2021-supplement.
FG and CG designed and supervised the study. All authors participated in sample analyses. FG wrote the paper with contributions from all authors.
The authors declare that they have no conflict of interest.
Publisher's note: Copernicus Publications remains neutral with regard to jurisdictional claims in published maps and institutional affiliations.
This article is part of the special issue “Atmospheric deposition in the low-nutrient–low-chlorophyll (LNLC) ocean: effects on marine life today and in the future (ACP/BG inter-journal SI)”. It is not associated with a conference.
The authors thank the captain and the crew of the R/V Pourquoi Pas? for their professionalism and their work at sea. Céline Ridame and Kahina Djaoudi are thanked for their help during sampling, Sophie Guasco and Marc Garel for their help in ectoenzymatic measurements on board.
This study is a contribution to the PEACETIME project, a joint initiative of the MERMEX and ChArMEx components supported by CNRS-INSU, IFREMER, CEA, and Météo-France as part of the programme MISTRALS coordinated by INSU. PEACETIME is a contribution to SOLAS and IMBER international programmes. The project was endorsed as a process study by GEOTRACES. The project leading to this publication has also received funding from the European FEDER Fund under project 1166-39417. Julie Dinasquet was funded by a Marie Curie Actions-International Outgoing Fellowship (PIOF-GA-2013-629378). The project leading to this publication has received funding from the European FEDER Fund under project 1166-39417. The research of Emilio Marañón and Maria Pérez-Lorenzo was supported by the Spanish Ministry of Science, Innovation and Universities through project POLARIS (grant no. PGC2018-094553B-I00) and by the European Union's Horizon 2020 research and innovation programme through project TRIAT-LAS (grant no. 817578).
This paper was edited by Silvia Becagli and reviewed by four anonymous referees.
Behrenfeld, M. J., O'Malley, R. T., Siegel, D. A., McClain, C. R., Sarmiento, J. L., Feldman, G. C., Milligan, A. J., Falkowski, P. G., Letelier, R. M., and Boss, E. S.: Climate-driven trends in contemporary ocean productivity, Nature, 444, 752–755, 2006.
Benner, R. and Strom, M.: A critical evaluation of the analytical blank associated with DOC measurements by high-temperature catalytic oxidation, Mar. Chem., 41, 153–160, https://doi.org/10.1016/0304-4203(93)90113-3, 1993.
Bishop, J. K. B., Davis, R. E., and Sherman, J. T.: Robotic observations of dust storm enhancement of carbon biomass in the North Pacific, Science, 298, 817–821, https://doi.org/10.1126/science.1074961, 2002.
Bonnet, S. and Guieu, C.: Atmospheric forcing on the annual iron cycle in the western Mediterranean Sea: A 1 year survey, J. Geophys. Res-Biogeo., 111, C09010, https://doi.org/10.1029/2005JC003213, 2006.
Bonnet, S., Guieu, C., Chiaverini, J., Ras, J., and Stock, A.: Effect of atmospheric nutrients on the autotrophic communities in a low nutrient, low chlorophyll system, Limnol. Oceanogr, 50, 1810–1819, https://doi.org/10.4319/lo.2005.50.6.1810, 2005.
Bosc, E., Bricaud, A., and Antoine, D.: Seasonal and interannual variability in algal biomass and primary production in the Mediterranean Sea, as derived from 4 years of SeaWiFS observations, Global Biogeochem. Cy., 18, GB1005, https://doi.org/10.1029/2003GB002034, 2004.
Boscolo-Galazzo, F., Crichton, K. A., Barker, S., and Pearson, P. N.: Temperature dependency of metabolic rates in the upper ocean: A positive feedback to global climate change?, Global Planet. Change, 170, 201–212, https://doi.org/10.1016/j.gloplacha.2018.08.017, 2018.
Bressac, M. and Guieu, C.: Post-depositional processes: What really happens to new atmospheric iron in the ocean's surface?, Global Biogeochem. Cy., 27, 859–870, https://doi.org/10.1002/gbc.20076, 2013.
Bressac, M., Guieu, C., Doxaran, D., Bourrin, F., Obolensky, G., and Grisoni, J.-M.: A mesocosm experiment coupled with optical measurements to assess the fate and sinking of atmospheric particles in clear oligotrophic waters, Geo-Mar. Lett., 32, 153–164, https://doi.org/10.1007/s00367-011-0269-4, 2012.
Bressac, M., Guieu, C., Doxaran, D., Bourrin, F., Desboeufs, K., Leblond, N., and Ridame, C.: Quantification of the lithogenic carbon pump following a simulated dust-deposition event in large mesocosms, Biogeosciences, 11, 1007–1020, https://doi.org/10.5194/bg-11-1007-2014, 2014.
Bressac, M., Wagener, T., Leblond, N., Tovar-Sánchez, A., Ridame, C., Albani, S., Guasco, S., Dufour, A., Jacquet, S., Dulac, F., Desboeufs, K., and Guieu, C.: Subsurface iron accumulation and rapid aluminium removal in the Mediterranean following African dust deposition, Biogeosciences Discuss. [preprint], https://doi.org/10.5194/bg-2021-87, in review, 2021.
Brown, J. H., Gillooly, J. F., Allen, A. P., Savage, V. M., and West, G. B.: Toward a Metabolic Theory of Ecology, Ecology, 85, 1771–1789, https://doi.org/10.1890/03-9000, 2004.
Cael, B. B. and Follows, M. J.: On the temperature dependence of oceanic export efficiency, Geophys. Res. Lett., 43, 5170–5175, https://doi.org/10.1002/2016GL068877, 2016.
Cael, B. B., Bisson, K., and Follows, M. J.: How have recent temperature changes affected the efficiency of ocean biological carbon export?, Limnol. Oceanogr. Lett., 2, 113–118, https://doi.org/10.1002/lol2.10042, 2017.
Calvo-Díaz, A., Díaz-Pérez, L., Suárez, L. Á., Morán, X. A. G., Teira, E., and Marañón, E.: Decrease in the Autotrophic-to-Heterotrophic Biomass Ratio of Picoplankton in Oligotrophic Marine Waters Due to Bottle Enclosure, Appl. Environ. Microb., 77(16), 5739–5746, https://doi.org/10.1128/AEM.00066-11, 2011.
Chen, B. and Laws, E. A.: Is there a difference of temperature sensitivity between marine phytoplankton and heterotrophs?, Limnol. Oceanogr., 62, 806–817, https://doi.org/10.1002/lno.10462, 2017.
Christaki, U., Van Wambeke, F., Lefevre, D., Lagaria, A., Prieur, L., Pujo-Pay, M., Grattepanche, J.-D., Colombet, J., Psarra, S., Dolan, J. R., Sime-Ngando, T., Conan, P., Weinbauer, M. G., and Moutin, T.: Microbial food webs and metabolic state across oligotrophic waters of the Mediterranean Sea during summer, Biogeosciences, 8, 1839–1852, https://doi.org/10.5194/bg-8-1839-2011, 2011.
del Giorgio, P. and Williams, P.: Respiration in Aquatic Ecosystems, Oxford University Press, 304 pp., https://doi.org/10.1093/acprof:oso/9780198527084.001.0001, 2005.
Desboeufs, K.: Nutrients atmospheric deposition and variability, in Atmospheric Chemistry in the Mediterranean – Vol. 2, From Pollutant Sources to Impacts, edited by: Dulac, F., Sauvage, S., and Hamonou, E., Springer, Cham, Switzerland, in press, 2021.
Desboeufs, K., Leblond, N., Wagener, T., Bon Nguyen, E., and Guieu, C.: Chemical fate and settling of mineral dust in surface seawater after atmospheric deposition observed from dust seeding experiments in large mesocosms, Biogeosciences, 11, 5581–5594, https://doi.org/10.5194/bg-11-5581-2014, 2014.
Dinasquet, J., Bigeard, E., Gazeau, F., Azam, F., Guieu, C., Marañón, E., Ridame, C., Van Wambeke, F., Obernosterer, I., and Baudoux, A.-C.: Impact of dust addition on the microbial food web under present and future conditions of pH and temperature, Biogeosciences Discuss. [preprint], https://doi.org/10.5194/bg-2021-143, in review, 2021.
Dittmar, T., Cherrier, J., and Ludwichowski, K.-U.: The analysis of amino acids in seawater, in Practical Guidelines for the Analysis of Seawater, edited by: Wurl, O., 67–77, CRC Press Taylor & Francis Group, Boca Raton, FL, 2009.
Emerson, S., Quay, P., Karl, D., Winn, C., Tupas, L., and Landry, M.: Experimental determination of the organic carbon flux from open-ocean surface waters, Nature, 389, 951–954, https://doi.org/10.1038/40111, 1997.
Engel, A.: Determination of marine gel particles, in Practical Guidelines for the Analysis of Seawater, edited by: Wurl, O., pp. 125–142, CRC Press Taylor & Francis Group, Boca Raton, FL, 2009.
Engel, A. and Händel, N.: A novel protocol for determining the concentration and composition of sugars in particulate and in high molecular weight dissolved organic matter (HMW-DOM) in seawater, Mar. Chem., 127, 180–191, https://doi.org/10.1016/j.marchem.2011.09.004, 2011.
Feliú, G., Pagano, M., Hidalgo, P., and Carlotti, F.: Structure and function of epipelagic mesozooplankton and their response to dust deposition events during the spring PEACETIME cruise in the Mediterranean Sea, Biogeosciences, 17, 5417–5441, https://doi.org/10.5194/bg-17-5417-2020, 2020.
Ferguson, R. L., Buckley, E. N., and Palumbo, A. V.: Response of marine bacterioplankton to differential filtration and confinement., Appl. Environ. Microb., 47, 49–55, 1984.
Friedlingstein, P., O'Sullivan, M., Jones, M. W., Andrew, R. M., Hauck, J., Olsen, A., Peters, G. P., Peters, W., Pongratz, J., Sitch, S., Le Quéré, C., Canadell, J. G., Ciais, P., Jackson, R. B., Alin, S., Aragão, L. E. O. C., Arneth, A., Arora, V., Bates, N. R., Becker, M., Benoit-Cattin, A., Bittig, H. C., Bopp, L., Bultan, S., Chandra, N., Chevallier, F., Chini, L. P., Evans, W., Florentie, L., Forster, P. M., Gasser, T., Gehlen, M., Gilfillan, D., Gkritzalis, T., Gregor, L., Gruber, N., Harris, I., Hartung, K., Haverd, V., Houghton, R. A., Ilyina, T., Jain, A. K., Joetzjer, E., Kadono, K., Kato, E., Kitidis, V., Korsbakken, J. I., Landschützer, P., Lefèvre, N., Lenton, A., Lienert, S., Liu, Z., Lombardozzi, D., Marland, G., Metzl, N., Munro, D. R., Nabel, J. E. M. S., Nakaoka, S.-I., Niwa, Y., O'Brien, K., Ono, T., Palmer, P. I., Pierrot, D., Poulter, B., Resplandy, L., Robertson, E., Rödenbeck, C., Schwinger, J., Séférian, R., Skjelvan, I., Smith, A. J. P., Sutton, A. J., Tanhua, T., Tans, P. P., Tian, H., Tilbrook, B., van der Werf, G., Vuichard, N., Walker, A. P., Wanninkhof, R., Watson, A. J., Willis, D., Wiltshire, A. J., Yuan, W., Yue, X., and Zaehle, S.: Global Carbon Budget 2020, Earth Syst. Sci. Data, 12, 3269–3340, https://doi.org/10.5194/essd-12-3269-2020, 2020.
Garcia-Corral, L. S., Holding, J. M., Carrillo-de-Albornoz, P., Steckbauer, A., Pérez-Lorenzo, M., Navarro, N., Serret, P., Gasol, J. M., Morán, X. A. G., Estrada, M., Fraile-Nuez, E., Benítez-Barrios, V., Agusti, S., and Duarte, C. M.: Temperature dependence of plankton community metabolism in the subtropical and tropical oceans, Global Biogeochem. Cy., 31, 1141–1154, https://doi.org/10.1002/2017GB005629, 2017.
Gillikin, D. P. and Bouillon, S.: Determination of δ18O of water and δ13C of dissolved inorganic carbon using a simple modification of an elemental analyser-isotope ratio mass spectrometer: an evaluation, Rapid Commun. Mass Sp., 21, 1475–1478, https://doi.org/10.1002/rcm.2968, 2007.
Gillooly, J. F., Brown, J. H., West, G. B., Savage, V. M., and Charnov, E. L.: Effects of size and temperature on metabolic rate, Science, 293, 2248–2251, https://doi.org/10.1126/science.1061967, 2001.
Guieu, C. and Ridame, C.: Impact of atmospheric deposition on marine chemistry and biogeochemistry, in: Atmospheric Chemistry in the Mediterranean Region: Comprehensive Diagnosis and Impacts, edited by: Dulac, F., Sauvage, S., and Hamonou, E., Springer, Cham, Switzerland, 2020.
Guieu, C., Loye-Pilot, M. D., Benyahya, L., and Dufour, A.: Spatial variability of atmospheric fluxes of metals (Al, Fe, Cd, Zn and Pb) and phosphorus over the whole Mediterranean from a one-year monitoring experiment: Biogeochemical implications, Mar. Chem., 120, 164–178, https://doi.org/10.1016/j.marchem.2009.02.004, 2010.
Guieu, C., Aumont, O., Paytan, A., Bopp, L., Law, C. S., Mahowald, N., Achterberg, E. P., Marañón, E., Salihoglu, B., Crise, A., Wagener, T., Herut, B., Desboeufs, K., Kanakidou, M., Olgun, N., Peters, F., Pulido-Villena, E., Tovar-Sanchez, A., and Völker, C.: The significance of the episodic nature of atmospheric deposition to Low Nutrient Low Chlorophyll regions, Global Biogeochem. Cy., 28, 1179–1198, https://doi.org/10.1002/2014GB004852, 2014a.
Guieu, C., Ridame, C., Pulido-Villena, E., Bressac, M., Desboeufs, K., and Dulac, F.: Impact of dust deposition on carbon budget: a tentative assessment from a mesocosm approach, Biogeosciences, 11, 5621–5635, https://doi.org/10.5194/bg-11-5621-2014, 2014b.
Guieu, C., Desboeufs, K., Albani, S., Alliouane, S., Aumont, O., Barbieux, M., Barrillon, S., Baudoux, A.-C., Berline, L., Bhairy, N., Bigeard. E., Bloss, M., Bressac, M., Brito, J., Carlotti, F., de Liege, G., Dinasquet, J., Djaoudi, K., Doglioli, A., D'Ortenzio, F., Doussin, J.-F., Duforet, L., Dulac, F., Dutay, J.-C., Engel, A., Feliu-Brito, G., Ferre, H., Formenti, P., Fu, F., Garcia, D., Garel, D., Gazeau, F., Giorio, C., Gregori, G., Grisoni, J.-M., Guasco, S., Guittonneau, J., Haëntjens, N., Heimburger, L.-E., Helias, S., Jacquet, S., Laurent, B., Leblond, N., Lefevre, D., Mallet, M., Marañón, E., Nabat, P., Nicosia, A., Obernosterer, I., Perez, L., M., Petrenko, A., Pulido-Villena, E., Raimbault, P., Ridame, C., Riffault, V., Rougier, G., Rousselet, L., Roy-Barman, M., Saiz- Lopez, A., Schmechtig, C., Sellegri, K., Siour, G., Taillandier, V., Tamburini, C., Thyssen, M., Tovar-Sanchez, A., Triquet, S., Uitz, J., Van Wambeke, F., Wagener, T., and Zaencker, B.: Bio-geochemical dataset collected during the PEACETIME cruise, Dataset, SEANOE, https://doi.org/10.17882/75747, 2020a.
Guieu, C., D'Ortenzio, F., Dulac, F., Taillandier, V., Doglioli, A., Petrenko, A., Barrillon, S., Mallet, M., Nabat, P., and Desboeufs, K.: Introduction: Process studies at the air–sea interface after atmospheric deposition in the Mediterranean Sea – objectives and strategy of the PEACETIME oceanographic campaign (May–June 2017), Biogeosciences, 17, 5563–5585, https://doi.org/10.5194/bg-17-5563-2020, 2020b.
Hein, M. and Sand-Jensen, K.: CO2 increases oceanic primary production, Nature, 388, 526–527, 1997.
Herut, B., Zohary, T., Krom, M. D., Mantoura, R. F. C., Pitta, P., Psarra, S., Rassoulzadegan, F., Tanaka, T., and Frede Thingstad, T.: Response of East Mediterranean surface water to Saharan dust: On-board microcosm experiment and field observations, Deep-Sea Res. Pt. II, 52, 3024–3040, https://doi.org/10.1016/j.dsr2.2005.09.003, 2005.
Herut, B., Rahav, E., Tsagaraki, T. M., Giannakourou, A., Tsiola, A., Psarra, S., Lagaria, A., Papageorgiou, N., Mihalopoulos, N., Theodosi, C. N., Violaki, K., Stathopoulou, E., Scoullos, M., Krom, M. D., Stockdale, A., Shi, Z., Berman-Frank, I., Meador, T. B., Tanaka, T., and Paraskevi, P.: The potential impact of Saharan dust and polluted aerosols on microbial populations in the East Mediterranean Sea, an overview of a mesocosm experimental approach, Frontiers in Marine Science, 3, 226, https://doi.org/10.3389/fmars.2016.00226, 2016.
Hoppe, H.-G.: Significance of exoenzymatic activities in the ecology of brackish water: measurements by means of methylumbelliferyl-substrates, Mar. Ecol. Prog. Ser., 11, 299–308, 1983.
IPCC: Climate Change 2013: The Physical Science Basis. Contri- bution of Working Group I to the Fifth Assessment Report of the Intergovernmental Panel on Climate Change, edited by: Stocker, T. F., Qin, D., Plattner, G.-K., Tignor, M., Allen, S. K., Boschung, J., Nauels, A., Xia, Y., Bex, V., and Midgley, P. M., Cambridge University Press, Cambridge, United Kingdom and New York, NY, USA, 1535 pp., 2013.
Irwin, A. J. and Oliver, M. J.: Are ocean deserts getting larger?, Geophys. Res. Lett., 36, L18609, https://doi.org/10.1029/2009gl039883, 2009.
Jickells, T. and Moore, C. M.: The importance of atmospheric deposition for ocean productivity, Annu. Rev. Ecol. Evol. S., 46, 481–501, https://doi.org/10.1146/annurev-ecolsys-112414-054118, 2015.
Kirchman, D. L., Kemp, P., Sherr, B., Sherr, E., and Cole, J.: Leucine incorporation as a measure of biomass production by heterotrophic bacteria, in: Handbook of methods in aquatic microbial ecology, 509–512, CRC Press, Boca Raton, https://doi.org/10.1201/9780203752746-59, 1993.
Klaas, C. and Archer, D. E.: Association of sinking organic matter with various types of mineral ballast in the deep sea: Implications for the rain ratio, Global Biogeochem. Cy., 16, 63-1–63–14, https://doi.org/10.1029/2001GB001765, 2002.
Knap, A., Michaels, A., Close, A., Ducklow, H., and Dickson, A.: Protocols for the Joint Global Ocean Flux Study (JGOFS) Core Measurements, UNESCO 1994, Paris, France, 1996.
Kouvarakis, G., Mihalopoulos, N., Tselepides, A., and Stavrakakis, S.: On the importance of atmospheric inputs of inorganic nitrogen species on the productivity of the Eastern Mediterranean Sea, Global Biogeochem. Cy., 15, 805–817, https://doi.org/10.1029/2001GB001399, 2001.
Kroeker, K. J., Kordas, R. L., Crim, R., Hendriks, I. E., Ramajo, L., Singh, G. S., Duarte, C. M., and Gattuso, J. P.: Impacts of ocean acidification on marine organisms: quantifying sensitivities and interaction with warming, Glob. Change Biol., 19, 1884–1896, https://doi.org/10.1111/gcb.12179, 2013.
Langer, G., Nehrke, G., Probert, I., Ly, J., and Ziveri, P.: Strain-specific responses of Emiliania huxleyi to changing seawater carbonate chemistry, Biogeosciences, 6, 2637–2646, https://doi.org/10.5194/bg-6-2637-2009, 2009.
Laurent, B., Audoux, T., Bibi, M., Dulac, F., and Bergametti, G.: Mass deposition in the Mediterranean region, in: Atmospheric Chemistry in the Mediterranean Region: Comprehensive Diagnosis and Impacts, edited by: Dulac, F., Sauvage, S., and Hamonou, E., Springer, Cham, Switzerland, 2021.
Lazzari, P., Solidoro, C., Salon, S., and Bolzon, G.: Spatial variability of phosphate and nitrate in the Mediterranean Sea: A modeling approach, Deep-Sea Res. Pt. I, 108, 39–52, https://doi.org/10.1016/j.dsr.2015.12.006, 2016.
Lekunberri, I., Lefort, T., Romero, E., Vázquez-Domínguez, E., Romera-Castillo, C., Marrasé, C., Peters, F., Weinbauer, M., and Gasol, J. M.: Effects of a dust deposition event on coastal marine microbial abundance and activity, bacterial community structure and ecosystem function, J. Plankton Res., 32, 381–396, https://doi.org/10.1093/plankt/fbp137, 2010.
Lemée, R., Rochelle-Newall, E., Van Wambeke, F., Pizay, M., Rinaldi, P., and Gattuso, J.-P.: Seasonal variation of bacterial production, respiration and growth efficiency in the open NW Mediterranean Sea, Aquat. Microb. Ecol., 29, 227–237, https://doi.org/10.3354/ame029227, 2002.
Lewandowska, A. M., Boyce, D. G., Hofmann, M., Matthiessen, B., Sommer, U., and Worm, B.: Effects of sea surface warming on marine plankton, Ecol. Lett., 17, 614–623, https://doi.org/10.1111/ele.12265, 2014.
Lindroth, P. and Mopper, K.: High performance liquid chromatographic determination of subpicomole amounts of amino acids by precolumn fluorescence derivatization with o-phthaldialdehyde, Anal. Chem., 51, 1667–1674, https://doi.org/10.1021/ac50047a019, 1979.
Longhurst, A., Sathyendranath, S., Platt, T., and Caverhill, C.: An estimate of global primary production in the ocean from satellite radiometer data, J. Plankton Res., 17, 1245–1271, https://doi.org/10.1093/plankt/17.6.1245, 1995.
Lopez-Urrutia, A. and Moran, X. A. G.: Resource limitation of bacterial production distorts the temperature dependence of oceanic carbon cycling, Ecology, 88, 817–822, 2007.
Louis, J., Pedrotti, M. L., Gazeau, F., and Guieu, C.: Experimental evidence of formation of transparent exopolymer particles (TEP) and POC export provoked by dust addition under current and high pCO2 conditions, PLOS ONE, 12, e0171980, https://doi.org/10.1371/journal.pone.0171980, 2017.
Loÿe-Pilot, M. D. and Martin, J. M.: Saharan Dust Input to the Western Mediterranean: An Eleven Years Record in Corsica, in The Impact of Desert Dust Across the Mediterranean, edited by: Guerzoni S. and Chester, R., 191–199, Springer Netherlands, Dordrecht, https://doi.org/10.1007/978-94-017-3354-0_18, 1996.
Mackey, K., Morris, J. J., Morel, F., and Kranz, S.: Response of photosynthesis to ocean acidification, Oceanography, 25, 74–91, https://doi.org/10.5670/oceanog.2015.33, 2015.
Marañón, E., Fernández, A., Mouriño-Carballido, B., MartÍnez-García, S., Teira, E., Cermeño, P., Chouciño, P., Huete-Ortega, M., Fernández, E., Calvo-DÍaz, A., Morán, X. A. G., Bode, A., Moreno-Ostos, E., Varela, M. M., Patey, M. D., and Achterberg, E. P.: Degree of oligotrophy controls the response of microbial plankton to Saharan dust, Limnol. Oceanogr., 55, 2339–2352, https://doi.org/10.4319/lo.2010.55.6.2339, 2010.
Marañón, E., Lorenzo, M. P., Cermeño, P., and Mouriño-Carballido, B.: Nutrient limitation suppresses the temperature dependence of phytoplankton metabolic rates, ISME J., 12, 1836–1845, https://doi.org/10.1038/s41396-018-0105-1, 2018.
Marañón, E., Van Wambeke, F., Uitz, J., Boss, E. S., Dimier, C., Dinasquet, J., Engel, A., Haëntjens, N., Pérez-Lorenzo, M., Taillandier, V., and Zäncker, B.: Deep maxima of phytoplankton biomass, primary production and bacterial production in the Mediterranean Sea, Biogeosciences, 18, 1749–1767, https://doi.org/10.5194/bg-18-1749-2021, 2021.
Mari, X.: Carbon content and C:N ratio of transparent exopolymeric particles (TEP) produced by bubbling exudates of diatoms, Mar. Ecol. Prog. Ser., 183, 59–71, https://doi.org/10.3354/meps183059, 1999.
Markaki, Z., Oikonomou, K., Kocak, M., Kouvarakis, G., Chaniotaki, A., Kubilay, N., and Mihalopoulos, N.: Atmospheric deposition of inorganic phosphorus in the Levantine Basin, eastern Mediterranean: Spatial and temporal variability and its role in seawater productivity, Limnol. Oceanogr., 48, 1557–1568, https://doi.org/10.4319/lo.2003.48.4.1557, 2003.
Maugendre, L., Gattuso, J.-P., Louis, J., de Kluijver, A., Marro, S., Soetaert, K., and Gazeau, F.: Effect of ocean warming and acidification on a plankton community in the NW Mediterranean Sea, ICES J. Mar. Sci., 72, 1744–1755, https://doi.org/10.1093/icesjms/fsu161, 2015.
Maugendre, L., Gattuso, J.-P., Poulton, A. J., Dellisanti, W., Gaubert, M., Guieu, C., and Gazeau, F.: No detectable effect of ocean acidification on plankton metabolism in the NW oligotrophic Mediterranean Sea: Results from two mesocosm studies, Estuar. Coast. Shelf S., 186, 89–99, https://doi.org/10.1016/j.ecss.2015.03.009, 2017a.
Maugendre, L., Guieu, C., Gattuso, J.-P., and Gazeau, F.: Ocean acidification in the Mediterranean Sea: Pelagic mesocosm experiments. A synthesis, Estuar. Coast. Shelf S., 186, 1–10, https://doi.org/10.1016/j.ecss.2017.01.006, 2017b.
McClain, C. R., Signorini, S. R., and Christian, J. R.: Subtropical gyre variability observed by ocean-color satellites, Deep-Sea Res. Pt. II, 51, 281–301, https://doi.org/10.1016/j.dsr2.2003.08.002, 2004.
Mercado, J. M., Sobrino, C., Neale, P. J., Segovia, M., Reul, A., Amorim, A. L., Carrillo, P., Claquin, P., Cabrerizo, M. J., León, P., Lorenzo, M. R., Medina-Sánchez, J. M., Montecino, V., Napoleon, C., Prasil, O., Putzeys, S., Salles, S., and Yebra, L.: Effect of CO2, nutrients and light on coastal plankton. II. Metabolic rates, Aquat. Biol., 22, 43–57, https://doi.org/10.3354/ab00606, 2014.
Mills, M. M., Moore, C. M., Langlois, R., Milne, A., Achterberg, E., Nachtigall, K., Lochte, K., Geider, R. J., and La, R. J.: Nitrogen and phosphorus co-limitation of bacterial productivity and growth in the oligotrophic subtropical North Atlantic, Limnol. Oceanogr., 53, 824–834, https://doi.org/10.4319/lo.2008.53.2.0824, 2008.
Mosseri, J., Quéguiner, B., Rimmelin, P., Leblond, N., and Guieu, C.: Silica fluxes in the northeast Atlantic frontal zone of Mode Water formation (38∘–45∘ N, 16∘–22∘ W) in 2001–2002, J. Geophys. Res-Oceans, 110, C07S19, https://doi.org/10.1029/2004JC002615, 2005.
Moulin, C. and Chiapello, I.: Impact of human-induced desertification on the intensification of Sahel dust emission and export over the last decades, Geophys. Res. Lett., 33, L18808, https://doi.org/10.1029/2006GL025923, 2006.
Moutin, T. and Raimbault, P.: Primary production, carbon export and nutrients availability in western and eastern Mediterranean Sea in early summer 1996 (MINOS cruise), J. Marine Syst., 33–34, 273–288, https://doi.org/10.1016/S0924-7963(02)00062-3, 2002.
Moutin, T., Thingstad, T. F., Wambeke, F. V., Marie, D., Slawyk, G., Raimbault, P., and Claustre, H.: Does competition for nanomolar phosphate supply explain the predominance of the cyanobacterium Synechococcus?, Limnol. Oceanogr., 47, 1562–1567, https://doi.org/10.4319/lo.2002.47.5.1562, 2002.
Müren, U., Berglund, J., Samuelsson, K., and Andersson, A.: Potential Effects of Elevated Sea-Water Temperature on Pelagic Food Webs, Hydrobiologia, 545, 153–166, https://doi.org/10.1007/s10750-005-2742-4, 2005.
Passow, U. and Carlson, C. A.: The biological pump in a high CO2 world, Mar. Ecol. Prog. Ser., 470, 249–271, 2012.
Polovina, J. J., Howell, E. A., and Abecassis, M.: Ocean's least productive waters are expanding, Geophys. Res. Lett., 35, L03618, https://doi.org/10.1029/2007gl031745, 2008.
Powley, H. R., Krom, M. D., and Cappellen, P. V.: Understanding the unique biogeochemistry of the Mediterranean Sea: Insights from a coupled phosphorus and nitrogen model, Global Biogeochem. Cy., 31, 1010–1031, https://doi.org/10.1002/2017GB005648, 2017.
Pulido-Villena, E., Wagener, T., and Guieu, C.: Bacterial response to dust pulses in the western Mediterranean: Implications for carbon cycling in the oligotrophic ocean, Global Biogeochem. Cy., 22, GB1020, https://doi.org/10.1029/2007gb003091, 2008.
Pulido-Villena, E., Baudoux, A.-C., Obernosterer, I., Landa, M., Caparros, J., Catala, P., Georges, C., Harmand, J., and Guieu, C.: Microbial food web dynamics in response to a Saharan dust event: results from a mesocosm study in the oligotrophic Mediterranean Sea, Biogeosciences, 11, 5607–5619, https://doi.org/10.5194/bg-11-5607-2014, 2014.
Regaudie-de-Gioux, A. and Duarte, C. M.: Temperature dependence of planktonic metabolism in the ocean, Global Biogeochem. Cy., 26, GB1015, https://doi.org/10.1029/2010GB003907, 2012.
Regaudie-de-Gioux, A., Vaquer-Sunyer, R., and Duarte, C. M.: Patterns in planktonic metabolism in the Mediterranean Sea, Biogeosciences, 6, 3081–3089, https://doi.org/10.5194/bg-6-3081-2009, 2009.
Ridame, C. and Guieu, C.: Saharan input of phosphate to the oligotrophic water of the open western Mediterranean Sea, Limnol. Oceanogr., 47, 856–869, 2002.
Riebesell, U., Schulz, K. G., Bellerby, R. G. J., Botros, M., Fritsche, P., Meyerhofer, M., Neill, C., Nondal, G., Oschlies, A., Wohlers, J., and Zollner, E.: Enhanced biological carbon consumption in a high CO2 ocean, Nature, 450, 545–548, https://doi.org/10.1038/nature06267, 2007.
Roshan, S. and DeVries, T.: Efficient dissolved organic carbon production and export in the oligotrophic ocean, Nat. Commun., 8, 2036, https://doi.org/10.1038/s41467-017-02227-3, 2017.
Schimmelmann, A., Qi, H., Coplen, T. B., Brand, W. A., Fong, J., Meier-Augenstein, W., Kemp, H. F., Toman, B., Ackermann, A., Assonov, S., Aerts-Bijma, A. T., Brejcha, R., Chikaraishi, Y., Darwish, T., Elsner, M., Gehre, M., Geilmann, H., Gröning, M., Hélie, J.-F., Herrero-Martín, S., Meijer, H. A. J., Sauer, P. E., Sessions, A. L., and Werner, R. A.: Organic Reference Materials for Hydrogen, Carbon, and Nitrogen Stable Isotope-Ratio Measurements: Caffeines, n-Alkanes, Fatty Acid Methyl Esters, Glycines, L-Valines, Polyethylenes, and Oils, Anal. Chem., 88, 4294–4302, https://doi.org/10.1021/acs.analchem.5b04392, 2016.
Schneider, C. A., Rasband, W. S., and Eliceiri, K. W.: NIH Image to ImageJ: 25 years of Image Analysis, Nat. Methods, 9, 671–675, 2012.
Siokou-Frangou, I., Christaki, U., Mazzocchi, M. G., Montresor, M., Ribera d'Alcalá, M., Vaqué, D., and Zingone, A.: Plankton in the open Mediterranean Sea: a review, Biogeosciences, 7, 1543–1586, https://doi.org/10.5194/bg-7-1543-2010, 2010.
Smith, D. C. and Azam, F.: A simple, economical method for measuring bacterial protein synthesis rates in seawater using 3H-leucine, Marine Microbial Food Webs, 6, 107–114, 1992.
Tanaka, T., Thingstad, T. F., Christaki, U., Colombet, J., Cornet-Barthaux, V., Courties, C., Grattepanche, J.-D., Lagaria, A., Nedoma, J., Oriol, L., Psarra, S., Pujo-Pay, M., and Van Wambeke, F.: Lack of P-limitation of phytoplankton and heterotrophic prokaryotes in surface waters of three anticyclonic eddies in the stratified Mediterranean Sea, Biogeosciences, 8, 525–538, https://doi.org/10.5194/bg-8-525-2011, 2011.
Ternon, E., Guieu, C., Loÿe-Pilot, M.-D., Leblond, N., Bosc, E., Gasser, B., Miquel, J.-C., and Martín, J.: The impact of Saharan dust on the particulate export in the water column of the North Western Mediterranean Sea, Biogeosciences, 7, 809–826, https://doi.org/10.5194/bg-7-809-2010, 2010.
Thingstad, T. F., Krom, M. D., Mantoura, R. F. C., Flaten, G. a. F., Groom, S., Herut, B., Kress, N., Law, C. S., Pasternak, A., Pitta, P., Psarra, S., Rassoulzadegan, F., Tanaka, T., Tselepides, A., Wassmann, P., Woodward, E. M. S., Riser, C. W., Zodiatis, G., and Zohary, T.: Nature of Phosphorus Limitation in the Ultraoligotrophic Eastern Mediterranean, Science, 309, 1068–1071, https://doi.org/10.1126/science.1112632, 2005.
Van Wambeke, F., Taillandier, V., Deboeufs, K., Pulido-Villena, E., Dinasquet, J., Engel, A., Marañón, E., Ridame, C., and Guieu, C.: Influence of atmospheric deposition on biogeochemical cycles in an oligotrophic ocean system, Biogeosciences Discuss. [preprint], https://doi.org/10.5194/bg-2020-411, in review, 2020.
Van Wambeke, F., Pulido, E., Catala, P., Dinasquet, J., Djaoudi, K., Engel, A., Garel, M., Guasco, S., Marie, B., Nunige, S., Taillandier, V., Zäncker, B., and Tamburini, C.: Spatial patterns of ectoenzymatic kinetics in relation to biogeochemical properties in the Mediterranean Sea and the concentration of the fluorogenic substrate used, Biogeosciences, 18, 2301–2323, https://doi.org/10.5194/bg-18-2301-2021, 2021.
Wang, Q., Lyu, Z., Omar, S., Cornell, S., Yang, Z., and Montagnes, D. J. S.: Predicting temperature impacts on aquatic productivity: Questioning the metabolic theory of ecology's “canonical” activation energies, Limnol. Oceanogr., 64, 1172–1185, https://doi.org/10.1002/lno.11105, 2019.
Zhu, L., Deng, Z., Xie, Y., Li, X., Li, F., Chen, X., Zou, Y., Zhang, C., and Wang, W.: Factors controlling Carex brevicuspis leaf litter decomposition and its contribution to surface soil organic carbon pool at different water levels, Biogeosciences, 18, 1–11, https://doi.org/10.5194/bg-18-1-2021, 2021.
Zobell, C. E. and Anderson, D. Q.: Observations on the multiplication of bacteria in different volumes of stored sea water and the influence of oxygen tension and solid surfaces, Biol. Bull., 71, 324–342, https://doi.org/10.2307/1537438, 1936.