

Seasonal Variations in the Biodiversity, Ecological Strategy, and Specialization of Diatoms and Copepods in a Coastal System With Phaeocystis Blooms: The Key Role of Trait Trade-Offs
 Elsa Breton1*,
  Urania Christaki1, Benoit Sautour2,
  Oscar Demonio3, Dimitra-Ioli Skouroliakou1, Gregory Beaugrand1, Laurent Seuront1,4,5, Loïck Kléparski1,6, Adrien Poquet1,7, Antoine Nowaczyk8, Muriel Crouvoisier1, Sophie Ferreira9, David Pecqueur10, Christophe Salmeron10, Jean-Michel Brylinski1,
  Arnaud Lheureux8 and
  Eric Goberville3
- 1Univ. Littoral Côte d’Opale, CNRS, Univ. Lille, UMR 8187 LOG, Wimereux, France
- 2Univ. Bordeaux, CNRS, UMR 5805 EPOC, Rue Geoffroy Saint Hilaire – Bâtiment, Pessac, France
- 3Unité Biologie des Organismes et Ecosystémes Aquatiques (BOREA), Muséum National d’Histoire Naturelle, CNRS, IRD, Sorbonne Université, Université de Caen Normandie, Université des Antilles, Paris, France
- 4Department of Marine Resources and Energy, Tokyo University of Marine Science and Technology, Tokyo, Japan
- 5Department of Zoology and Entomology, Rhodes University, Grahamstown, South Africa
- 6Marine Biological Association, Citadel Hill, Plymouth, United Kingdom
- 7Univ. Côte d’Azur, CNRS, INSERM, IRCAN, Medical School of Nice, Nice, France
- 8Univ. Bordeaux, CNRS, UMR 5805 EPOC, Station Marine d’Arcachon, Arcachon, France
- 9Observatoire Océanologique de Banyuls s/mer, FR 3724 – Laboratoire Arago – SU/CNRS, Banyuls-sur-Mer, France
- 10Univ. Bordeaux, CNRS, OASU, UMS 2567 POREA, Allée Geoffroy Saint-Hilaire, Pessac, France
Although eutrophication induced by anthropogenic nutrient enrichment is a driver of shifts in community composition and eventually a threat to marine biodiversity, the causes and consequences on ecosystem functioning remain greatly unknown. In this study, by applying a trait-based approach and measuring niche breadth of diatoms and copepods, the drivers and underlying mechanisms of the seasonal species succession of these ecological communities in a coastal system dominated in spring by Phaeocystis blooms were explored. It is suggested that the seasonal succession of diatoms and copepods is the result of several trade-offs among functional traits that are controlled by the seasonal abiotic and biotic pressure encountered by the plankton communities. The results of this study highlight that a trade-off between competition and predator, i.e., weak competitors are better protected against predation, plays an important role in promoting plankton species richness and triggers the Phaeocystis bloom. As often observed in eutrophicated ecosystems, only the biotic homogenization of the copepod community and the shift in the diet of copepods toward Phaeocystis detrital materials have been detected during the Phaeocystis bloom. The diatom and copepod communities respond synchronously to fluctuating resources and biotic conditions by successively selecting species with specific traits. This study confirms the key role of competition and predation in controlling annual plankton succession.
Introduction
Coastal eutrophication induced by anthropogenic nutrient enrichment is one of the major threats to biodiversity (Vitousek et al., 1997; Halpern et al., 2008; Howarth, 2008). However, assessing the impact of eutrophication on biodiversity is a difficult task, because the multiple drivers shaping biodiversity interact and operate at different interconnected temporal and spatial scales (e.g., White et al., 2010; Dray et al., 2012; Hill et al., 2016). Eutrophication may not only cause excessive blooms of opportunistic species, species loss (Smith and Schindler, 2009) but also, subtle changes in functional trait composition; and may even lead to a loss of functional diversity (FD) caused by a biotic homogenization by favoring generalist (species with broad environmental tolerances) over specialist (species well adapted to particular habitats) species: the latter showed narrower niche breadth and a lower tolerance to high nutrient levels (e.g., Clavel et al., 2011; Nelson et al., 2013; Villéger et al., 2014; Wengrat et al., 2018; Chihoub et al., 2020). Functional traits are biological characteristics that influence the performance and survival of organisms (Violle et al., 2007). Biotic changes may alter biodiversity by selecting species that possess functional traits that confer to them a selecting advantage. For instance, light limitation, which typically occurs under high primary production events, may select species with morphological features that allow them to enhance their buoyancy (Naselli-Flores et al., 2021 and references therein). Communities mainly composed of functionally redundant species may improve ecosystem resilience and stability (e.g., Biggs et al., 2020), but the loss of FD and/or specialist species may deteriorate ecosystem functioning (Olden et al., 2004; Pan et al., 2016; Alexander et al., 2017). Understanding how functional traits relate to associated ecological strategies (i.e., a combination of functional attributes reflecting how species cope with their environment) and ecological specialization across productivity gradients, which defines the degree of tolerance to changing environmental conditions, is, therefore, important to better measure ecosystem functioning and health.
Over the last decade, trait-based approaches have been increasingly used in plankton ecology to understand the drivers of biodiversity changes along environmental gradients and to propose ecological generalities and predictions across ecosystems. Because functional traits mediate the responses of the species to their abiotic and biotic environment (Violle et al., 2007), they help to: (i) better understand how organisms interact with their surrounding environment; and (ii) identify key processes that influence biodiversity such as trait trade-offs (e.g., Kneitel and Chase, 2004; Litchman et al., 2007). While functional identity informs on competitiveness and ecological strategies (e.g., predation avoidance, Shipley, 2010; Muscarella and Uriarte, 2016), FD, in combination with null modeling, informs on the degree of functional convergence of a community and detects mechanisms of community assembly (e.g., abiotic filtering and competitive interactions, Mason et al., 2013). As it may influence conclusions, trait choice is a critical issue (Zhu et al., 2017) when: studying resource traits (e.g., nutrient uptake and light absorption); under-dispersion of traits reflects environmental filtering and/or hierarchical competition (Mayfield and Levine, 2010); and over-dispersion of traits is related to a competition governed by niche differences (Macarthur and Levins, 1967; Cornwell and Ackerly, 2009). When focusing on defense traits against predation (e.g., setae and toxin production), under-dispersion is related to a high predation pressure by generalists, and over-dispersion to a high predation pressure by specialists (Cavender-Bares et al., 2009).
The Eastern English Channel (EEC) is a well-mixed meso-eutrophic sea undergoing multiple environmental disturbances such as temperature rise (McLean et al., 2019) and nutrient enrichment, mainly from the Seine and Somme rivers (Thieu et al., 2009) as a result of anthropogenic activities in the watersheds, especially intensive agriculture practices (e.g., Garnier et al., 2019). This nutrient enrichment is known to trigger the recurrent spring Phaeocystis blooms of EEC (Lancelot et al., 1987; Lancelot, 1995; Breton et al., 2000, Breton et al., 2017; Grattepanche et al., 2011a,b; Bonato et al., 2016; Ménesguen et al., 2018). By affecting the diatom and copepod communities, two interacting key compartments of the ecosystem trophodynamics (Smetacek, 1999; Tréguer and Pondaven, 2000; Beaugrand et al., 2003; Kiørboe, 2011; Mitra et al., 2014; Steinberg and Landry, 2017), this prymnesiophyte can disrupt the structure of the food web (Schoemann et al., 2005; Nejstgaard et al., 2007), especially during the late winter/spring and summer/autumn periods (Gasparini et al., 2000; Antajan, 2004).
By applying a functional trait-based approach to diatom and copepod communities collected over the period 2007–2013, and by measuring niche breadth of resources used and environmental conditions tolerated both at the species- and community level, the aims were to: (i) understand how diatoms and copepods in coastal waters of the EEC respond to seasonally changing environmental conditions; (ii) determine what drives plankton species richness and ecological specialization; and (iii) test whether taxonomic (species richness) and FD [functional richness (FRic), functional evenness (FEve), and functional divergence (Rao Quadratic entropy, RaoQ)] of plankton communities were affected by Phaeocystis blooms. Protozooplankton biomass (i.e., the sum of heterotrophic dinoflagellate, ciliate, and tintinnid biomass) and co-occurring phytoplankton groups were also considered in this study because of: (i) the diverse trophic regimes and feeding strategies of copepods depend on their food environment (Kleppel, 1993); (ii) diatoms may also be the prey of other predators other than copepods (e.g., Grattepanche et al., 2011b); and (iii) knowledge of the whole community composition may help to better depict trade-offs.
Materials and Methods
Datasets
Hydrological and phytoplankton samples were collected at high tide at coastal station “C” (50°40′75 N; 1°31′17 E, 20–25 m maximum depth), which belongs to the French monitoring network SOMLIT1. Sampling was carried out on an average of every 3 weeks from February 2007 to December 2013. Subsurface (2 m depth) temperature (SST, °C) and salinity (S) were measured with a conductivity temperature depth (CTD) Seabird profiler equipped with photosynthetically active radiation (PAR, E m–2 d–1) sensor (QSP 2300; Biospherical Instruments Inc.). Dissolved inorganic phosphorous (DIP, μM), inorganic silica (DSi, μM), and inorganic nitrogen [the sum of nitrates, nitrites, and ammonium; (DIN, μM)], total suspended matter (TSM, mg L–1), chlorophyll a (Chla, μg L–1), particulate organic carbon (POC, μgC L–1), phytoplankton, and protozooplankton were measured by means of a Niskin Water Sampler (8 L). Nutrient concentrations were quantified according to Aminot and Kérouel (2004) using autoanalyzer systems (Technicon, Alliance, and Seal Instruments), except for ammonium concentrations (NH4), which were assessed by fluorimetry according to Holmes et al. (1999) and Taylor et al. (2007). TSM was determined by filtrating a known volume of seawater through 47 mm precombusted and preweighed glass fiber filters (Whatman, GF/F, 47 mm), and drying it at 50°C for 24 h. POC was determined using a NA2100 Frisons CHN analyzer after filtration of 100–500 ml subsamples through precombusted glass fiber filters (Whatman, GF/F, 25 mm), then dried for at least 48 h at 50°C and exposed to HCl 1 N vapors for 5 h. Chla was estimated by fluorometry (Lorenzen, 1967) from subsample (100–250 ml) of seawater filtrated through glass fiber filters (Whatman, GF/F, 25 mm) and free of pigment (extraction in acetone 90% in the dark at 4°C for 12 h). The minimal volume values corresponded to the Phaeocystis bloom period that leads quickly to filter clogging. The maximal volume value corresponds to the maximal value fixed by the SOMLIT network. The average daily PAR experienced by phytoplankton in the water column, for 6 days before sampling, was obtained from a diffuse fraction (kd, m–1) and global solar radiation (GSR, Wh m–2) from the Copernicus Atmosphere Monitoring Service (CAMS) radiation service2 using the formula of Riley (1957). GSR was converted into PAR by assuming PAR to be 50% of GSR and by considering 1 W m–2 = 0.36 E m–2 d–1 (Morel and Smith, 1974). Wind stress (Pa) and direction (i.e., eastward and northward components of horizontal winds), as proxies of regional turbulence (e.g., MacKenzie and Leggett, 1991), were obtained from the National Center for Atmospheric Research (NCAR, United States)3 and the National Centers for Environmental Prediction (NCEP, United States). Subsurface and near-bottom environmental values were averaged for niche analysis (refer below “Ecological specialization”).
Copepods were collected on 96 separate occasions (sampling frequency of 4 weeks) with vertical hauls from the bottom (ca. ∼ 20–25 m depth) to the surface using a 200-μm mesh size working party (WP) 2 plankton net. The volume filtered was measured with a Tsurumi – Seiki (TSK) flowmeter (Tokyo Seimitsu Co. Ltd) and mounted on the mouth of the net (0.25 m2 mouth area). The volume of filtered seawater varied between 1 and 11 m3, the lowest values being recorded during the Phaeocystis bloom (from mid-April to mid-May) as a result of rapid net clogging. All copepod samples were preserved with 4% formaldehyde buffered with borax. The composition and abundance of copepods were determined under stereomicroscopy (Nikon SMZ1500) with 10–100x magnification in Dollfus chambers according to the determination key provided by Rose (1933). Copepod carbon biomass was calculated from (i) the median of the minimum and maximum weights for the CV and CVI copepodite stages; and (ii) the regression equations relating wet weight and dry weight (mg) to carbon (mg C, Wiebe, 1988). The minimum and maximum weights were estimated from the range values of copepodite length reviewed by Conway (2006) for the North Atlantic sector and species-specific length-weight relationships (Durbin and Durbin, 1978; Cohen and Lough, 1981; Williams and Robins, 1982; Dam and Peterson, 1991; Zakaria et al., 2018). The list of the copepod species identified in this study, the final carbon conversion factor values and their corresponding frequencies (%) and average biomasses (μgC L–1), are shown in Supplementary Table 1. Diatom, Phaeocystis, and dinoflagellate samples were fixed with Lugol-glutaraldehyde solution (1% v/v, a fixative that does not disrupt Phaeocystis colonies; Breton et al., 2006) and were kept at 4°C in the dark until microscopy analysis. Other protozooplankton samples, i.e., ciliates and tintinnids, were fixed with formaldehyde (Grattepanche et al., 2011a). Samples were examined using an inverted microscope (Nikon Eclipse TE2000-S) with 100–400x magnification after sedimentation in 5–25 ml and 25–100 ml Hydrobios chambers for phytoplankton and protozooplankton, respectively. Identifications were identified at the species level when possible, according to taxonomic literature (Halse and Syvertsen, 1996; Hoppenrath et al., 2009, for phytoplankton; Schiller, 1931–1937; Maar et al., 2002; Gómez and Souissi, 2007, for heterotrophic dinoflagellates; Kofoid and Campbell, 1929; Plankton Ciliate Project, 2002, for ciliates). For Synechococcus spp., picoeukaryotes, and cryptophytes, 5 ml samples were fixed with glutaraldehyde (1.33% v/v) and kept at −80°C until flow cytometry analysis (FACScan, BD Biosciences, Marie et al., 1999). Biovolumes were estimated using standard geometric forms according to Hillebrand et al. (1999). The number of Phaeocystis cells in the colonial stage of life was counted according to biovolume measurements of the colonies (Rousseau et al., 1990). Carbon biomass (μgC l–1) of phytoplankton and heterotrophic dinoflagellates was calculated using the carbon conversion factors of Menden-Deuer and Lessard (2000). For Phaeocystis solitary cells, Synechococcus spp., and picoeukaryotes, the values of 89.5 pg C cell–1 (van Rijssel et al., 1997), 154 fg cell–1, and 1319 fg cell–1 (Buitenhuis et al., 2012) were used, respectively. For flagellated and solitary colonial cells, only discriminated since 2007, the carbon conversion factors of 10.8 and 14.15 pg C/cell were applied, respectively (refer Table 1 in Schoemann et al., 2005). The biomass of ciliates and tintinnids was calculated using a conversion factor of 0.19 pg μm–3 (Putt and Stoecker, 1989; refer Supplementary Tables 1–4 and Supplementary Data for species list and biomass estimates).
TABLE 1
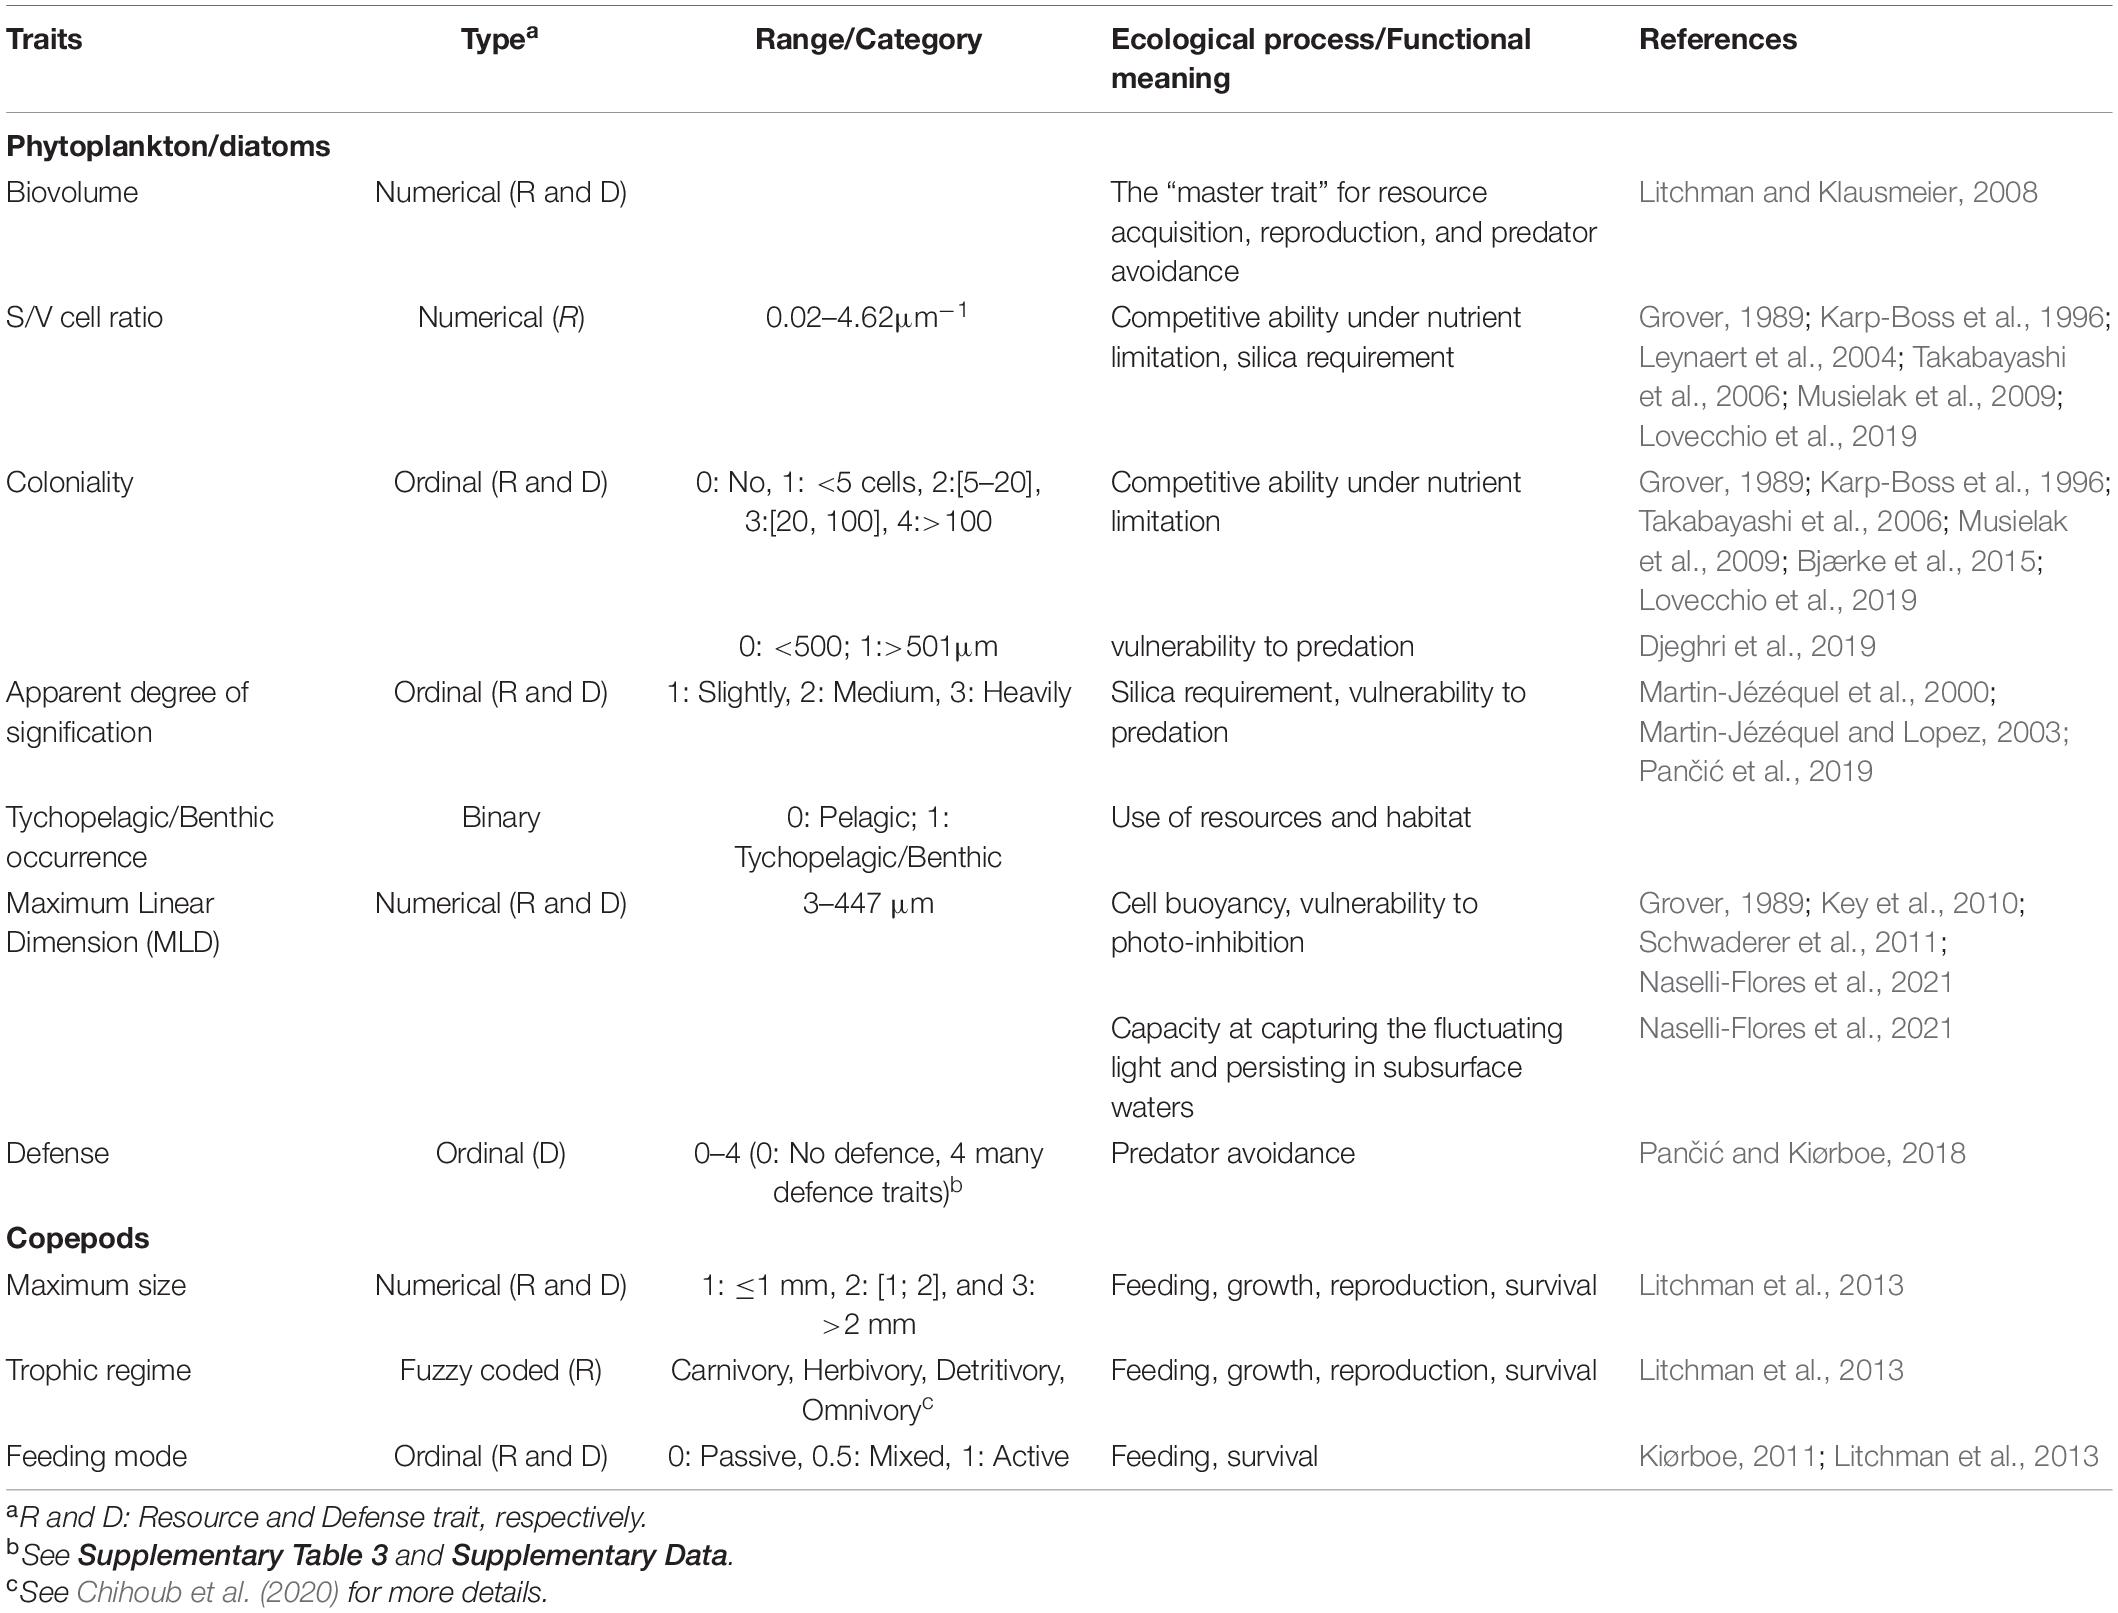
Table 1. List of the diatom and copepod traits used in this study and their functional meaning.
Phytoplankton and Copepod Species Traits
Information on resource traits is scarce in the literature for most phytoplankton species (Litchman and Klausmeier, 2008; Breton et al., 2017). Consequently, an a posteriori approach to defining resource use and requirement traits was used. For each species, biovolume (V, μm3), maximum linear dimension (MLD, μm), and the surface to biovolume cell ratio (S/V ratio) were calculated from the median values of a series of microscopic measures over the entire 1996–2019 diatom datasets acquired at Station “C” (Breton unpublished data). The apparent degree of silicification (1: slight; 2: medium; 3: heavy) and Tychopelagic/benthic habit (0: pelagic; 1: tychopelagic/benthic) was based on information from phytoplankton taxonomic literature (e.g., Halse and Syvertsen, 1996; Hoppenrath et al., 2009). The potential degree of coloniality (0: None; 1: <5 cells; 2: 5–20 cells; 3: >20 cells) was assessed through the cultivation of each diatom species under F/20 medium and with a light: dark cycle of 12:12 h at an irradiance of 400 μmol photons m–2 s–1 (Daylight HQIT-WD 250 W F, OSRAM GmbH, Munich, Germany).
Biovolume is a key trait because it relates to the various ecophysiological attributes for resource acquisition, reproduction, and predator avoidance (Litchman and Klausmeier, 2008; Table 1). Species with high S/V cell ratio and long cellular chain length that favor cell suspension in the water column and increase nutrient flux have a great competitive ability under nutrient limitation (Grover, 1989; Karp-Boss et al., 1996; Takabayashi et al., 2006; Musielak et al., 2009; Lovecchio et al., 2019). Higher S/V cell ratio and weaker silicified species have also been related to lower silica requirement under laboratory conditions [(Leynaert et al., 2004) and to DSi limitation (Martin-Jézéquel et al., 2000; Martin-Jézéquel and Lopez, 2003)]. Cell elongation enhances both cell buoyancy (Grover, 1989; Naselli-Flores et al., 2021) and protection against photoinhibition, especially for larger cells (Key et al., 2010; Schwaderer et al., 2011). The binary trait “Tychopelagic/benthic habit” may be informative of resource use and requirement, as benthic diatoms are often highly photosynthetic efficient species and potentially facultative heterotrophs (Cahoon, 1999). This trait may be also an indicator of ecosystem health, as demonstrated by the positive relationship between the FD of benthic diatoms and the productivity of coastal waters in the Baltic Sea (Virta et al., 2019). Besides reflecting resource use and/or requirement, prey biovolume (Litchman and Klausmeier, 2008), the degree of coloniality (Bjærke et al., 2015), and the apparent degree of silicification (Pančić et al., 2019) mirror ecological processes/functions linked to predation. By including: (i) the capacity to produce mucous or toxins; (ii) the presence of setae and/or spicules (that also favor buoyancy; Van den Hoek et al., 1995); (iii) the degree of silicification; and (iv) coloniality, the composite of defense traits reflect alteration of copepod grazing (Pančić and Kiørboe, 2018). The composite trait was obtained by summing the scores of each of these traits (refer Supplementary Table 5 and Supplementary Data).
The carbon-to-chlorophyll ratio for phytoplankton (C/Chla ratio, in μgC μgChla–1) and timing of bloom initiation of diatoms (in months) were then calculated. Although not being traits per se (Litchman and Klausmeier, 2008), they are the outcome of processes linking the actual traits of species and the alleviation, or accentuation, of external limiting factors, such as grazing pressure or nutrients/light availability (Thackeray et al., 2008; Jakobsen and Markager, 2016). The C/Chla ratio was calculated using microscopic counts and the cell carbon was computed from the equations of Menden-Deuer and Lessard (2000). Timing of bloom initiation of diatoms at Station “C” (refer Supplementary Data) was based on the cumulative biomass-based threshold method (Brody et al., 2013), using mean monthly diatom abundances over the period 1996–2019 and a limit value of 20%.
For copepods: (i) maximum size (mm); (ii) trophic preference (herbivory, carnivory, detritivory, and omnivory); and (iii) feeding mode (0: passive, 1: active, and 0.5: mixed feeding) were selected, as they directly/indirectly influence species fitness through growth, reproduction, and/or survival (Litchman et al., 2013; Kiørboe and Hirst, 2014). Most of them are responsive to changes in environmental conditions (McGinty et al., 2018). Data were obtained from the copepod trait database constructed by Benedetti et al. (2016) and completed by Brun et al. (2017), and references therein. For each copepod species, all available information on species size was compiled, and the maximum size value as representative of adult species was kept, note that sexual dimorphism was not considered. The degree of herbivory (carnivory, detritivory, or omnivory) was coded following Mondy and Usseglio-Polatera (2014). In this study, a coefficient of (i) 1/3 for omnivore; (ii) 2/3 for omnivore-herbivory (dominance of herbivory in copepod diet) or 2/3 for omnivore-carnivory (dominance of carnivory in copepod diet), with 1/4 for the two other diet categories; and (iii) 1 for species with carnivore/herbivore/detritivore diets, and 0 for the two other diet categories (refer Chihoub et al., 2020 for more details) was applied.
FD Metrics
In this study, four metrics (Step 1, refer Supplementary Figure 1 for a description of the five main steps of the statistical method) to characterize the functional structure and diversity of diatom and copepod communities were used as follows: (i) community-weighted mean (CWM); (ii) FRic, (iii) FEve; and (iv) Rao Quadratic entropy (RaoQ) as a proxy of functional divergence. CWM, the mean trait value among each community weighted by the relative biomass of each species (Garnier et al., 2004), is a proxy of functional identity. FRic corresponds to the volume of functional niche space filled by a species within a community (Villéger et al., 2008). FEve corresponds to the regularity with which species biomass in a community is distributed along the minimum spanning tree that links all species in the multidimensional trait space (Mason et al., 2005). RaoQ is the sum of pairwise distances between species, weighted by the relative biomass within the multidimensional trait space. This index was selected over the functional divergence metric for its stronger ability to detect assembly rules (Botta-Dukát, 2005; Botta-Dukát and Czúcz, 2016). The FD indices of the diatom community were calculated from the biovolume, the apparent degree of silicification, coloniality, the S/V cell ratio, MLD, and defense traits (as shown in Supplementary Table 5). For each observation (i.e., sampling unit), functional metrics were computed on log-transformed species biomass, to reduce a potential influence of outliers, using the R package (R version 3.5.3, 2019) “FD” (Laliberté and Legendre, 2010). A preliminary principal coordinate analysis (PCoA; “vegan” package; and Oksanen et al., 2011) was performed to calculate the multidimensional trait space for each sampling day and FD was calculated from a dissimilarity matrix calculated using both the PCoA axis, as new functional traits, and the Gower distance (Gower, 1971). The Gower distance allows us to combine traits of different types, including ordinal (Podani, 1999; Table 1). A square root transformation (“sqrt”), or a Lingoes correction for negative values (Lingoes, 1971), was applied when the distance matrix “species × species” was not Euclidean. The quality of the functional space (i.e., the similarity between the functional space and initial functional trait values) based on the corrected distance matrix varied from 0.64 to 0.94. The inference of environmental filtering and biotic interactions (Step 2, Supplementary Figure 1) was estimated from the deviation [standardized effect size (SES); Gotelli and McCabe, 2002] between functional metrics calculated on a given (i.e., observed) diatom community and functional values obtained from a random community: for each sampling date, trait data were randomized 999 times (“permatfull” in the “vegan” package), while maintaining species richness and abundance constant. SES was calculated as follows:
where xobs is the observed values of the functional metric at a given date; is the mean, and σran is the SD of the FD of randomly assembled communities. Assuming a normal distribution of the random communities, the traits derived from the sampling dates falling into the 95th (or higher) percentile of the random distribution were considered “over-dispersed” (i.e., niche differentiation being the major process driving community assembly) and trait falling into the 5th (or lower) percentile were considered “under-dispersed” (i.e., environmental filtering as the major process).
Ecological Specialization
Ecological specialization (Step 3, Supplementary Figure 1) was estimated by means of the multidimensional outlying mean index (OMI, hereafter called “environmental tolerance,” Dolédec et al., 2000) and unidimensional niche breadth analysis using the “ade4” (Chessel et al., 2004; Dray et al., 2007) and “hypervolume” packages (Blonder et al., 2014). The OMI was selected because it does not rely on any expected species response curves to environmental gradients and outperforms classical methods such as canonical correspondence or redundancy analysis (Dolédec et al., 2000). The OMI analysis seeks combinations of environmental variables that maximize average species marginality, i.e., the squared Euclidean distance between the mean environmental conditions used by a species and the mean environmental conditions available to this species. Hypervolume estimates the niche breadth of one or several dimensions from the calculation of uni or multivariate kernel density. This method captures irregular shapes and does not require a specific density function, unlike OMI analysis that requires normal distribution: estimation of the hypervolume is, therefore, more accurate when high-dimensional or holey datasets are considered. An accurate estimate of kernel density requires high amounts of trait/environmental data, which rises as dimensionality increases, however (e.g., about >67 and >770 for three and five dimensions, respectively, Silverman, 1986). For a comprehensive assessment of environmental gradients, the calculation was, therefore, based on the ecological specialization of long-term diatom and copepods datasets, collected between 1996 and 2019 at the station “C,” and from 2001 to 2017, respectively, in the downstream part of the Gironde estuary (Breton et al., 2000; Schapira et al., 2008; Breton et al., 2017; Richirt et al., 2019).
Environmental tolerance was based on species biomass, considering: (i) SST, S, Pa, nutrients, and PAR for diatoms; and (ii) SST, S, Pa, TSM, and POC for copepods. Unidimensional niche breadth related to resources (DIN, DIP, DSi, and light for diatoms; TSM and POC for copepods) was determined from kernel density using the environmental conditions encountered by species when present with a Silverman bandwidth estimator and a 0% quantile threshold (Blonder et al., 2014). An increase in these two indices of ecological specialization mirrors an decrease in the degree of specialization of the diatom or copepod community. Trophic homogenization within the copepod community was assessed from trophic preferences and feeding mode, as recommended by Mondy and Usseglio-Polatera (2014). For each copepod species and trophic trait, we first calculated the taxon specialization index (TSI) using the Gini-Simpson index (Gini, 1912; Simpson, 1949). Each TSI, where the trophic preference (the feeding mode) describes the degree of omnivory (the capacity to alternate between passive and active feeding), was then scaled by its respective minimum and maximum values to account for the different number of categories among traits (Mondy and Usseglio-Polatera, 2014). The community specialization index (CSI) was finally computed as the CWMs of each TSI: a value of 0 (1) corresponds to truly generalists (truly specialists).
All analyses were performed with R (R Development Core Team), version 3.5.3.
Exploratory Analyses
First, box plots (Step 4, Supplementary Figure 1) were computed combined with a locally weighted scatterplot smoothing (LOESS; Jacoby, 2000) curve in association with a 95% confidence interval (function “geom_smooth,” package “ggplot2,” Wickham, 2016) to depict the seasonal variations. Monthly differences were assessed by a Kruskal–Wallis test, followed by a post hoc Nemenyi test (Legendre and Legendre, 1998; package “PMCMRplus,” Pohlert, 2014). To explore and summarize seasonal changes in the abiotic environment, a principal component analysis (PCA) was performed with the “ade4” package. To explore seasonal variations in both the mean values of key biological traits and in the degree of ecological specialization of the diatom and copepod communities, a PCoA (Step 4, Supplementary Figure 1) was computed on a community dissimilarity matrix (Gower distance) using monthly data of niche breadth and CWMs of different functional attributes. The coupling (Step 5, Supplementary Figure 1) between the environment and key biological attributes (species biomass, functional structure, ecological specialization, and FD of diatoms and copepods) was then estimated by computing two separated co-inertia analysis (COIA; Dolédec and Chessel, 1994; Dray et al., 2003) on monthly means using the “ade4” package. Prior to all multivariate analysis, and for each variable, skewness of the data was removed to reach normality and all variables were to have a mean of zero and a SD of one (“caret” package; Kuhn et al., 2016). The principle of COIA consists of finding co-inertia axis by maximizing the covariance between the row coordinates of two matrices (in this study, the environmental variables and either diatoms or copepods). It defines axis that simultaneously explain the highest possible variance in each of the two matrices and describes their closest common structure. First, a PCA was performed on each matrix, and then applied the COIA (Dray et al., 2003). Explanatory environmental variables were: Pa and direction, S, SST, DIN, DIP, DSi, and protozooplankton biomass. While PAR and copepods biomass were included as additional explanatory environmental variables for diatoms, diatom biomass was added, the defense trait against predation (expressed as CWM) for copepods, and the abundance of their main predators (i.e., Chaetognaths, fish larvae and jellyfish; Hirst and Kiørboe, 2002). The COIA was sequentially built for: (i) environment vs. diatoms; and (ii) environment vs. copepods, with a manual backward selection of the significant variables to obtain the highest coupling coefficients, the strength of the coupling being based on the multidimensional correlation coefficient (RV; Robert and Escoufier, 1976). The variables included in the final COIA were selected (i) only if they displayed a significant seasonal trend in box-plots (refer the final list above), and depending on both (ii) the RV value and (iii) the contribution of variables to the construction of the co-inertia axis. The latter was estimated by means of Pearson correlation calculated between the variables and the scores of samplings on the COIA axis. Although the loadings describe how each variable contributes to each co-inertia axis, such information can be retrieved by the correlation coefficient between the variables and the co-inertia axis. A Monte Carlo permutation procedure (1,000 permutations) was applied to compute the RV and statistical significance. For PCA, PCoA, and COIA analyses, an ascending hierarchical classification (AHC) was used with Ward’s aggregation criterion on the two first component coordinates (“hclust” function of the “ade4” package) to reveal monthly clusters.
A variation partitioning (VP) analysis (Step 5, Supplementary Figure 1; “vegan” package; Borcard et al., 1992; Legendre and Legendre, 2012) was finally performed to estimate the contribution of Phaeocystis blooms, water masses, hydrometeorological (Pa and/or direction as proxies), and local environmental conditions (S, nutrients, PAR, and predator and/or prey biomass) on changes in the functional structure (i.e., the CWMs), ecological specialization (i.e., environmental tolerance and niche breadths), and FD (SES-RaoQ) of the diatom and copepod communities. To explain variations in species richness of the diatom and copepod communities, the contribution of assembly rules was added using SES-RaoQ as a proxy. SES-RaoQ is known to be the most appropriate FD index (Botta-Dukát and Czúcz, 2016) to detect both environmental filtering (trait convergence) and competition based on niche difference (trait divergence). As for the COIA, variables that attest to the hydrometeorological and local environmental conditions (abiotic and prey biomass) were selected backward to obtain the lowest residual proportion. To explore the effect of Phaeocystis blooms on species richness, functional structure, ecological specialization, and FD of the diatom community, a Kruskal–Wallis test was performed using different classes of Phaeocystis biomass [1: <100; 2: (100, 500); 3: (500, 1000); 4: >1,000 μgC L–1] coming from the 1996 to 2019 dataset (refer “Ecological specialization”).
Results
Abiotic Environment and Plankton Composition and Biomass
The first principal component (PC1, 48.5% of the total variance) showed a seasonal gradient from relatively high turbulent (Pa as a proxy), less saline, nutrient-rich (DIN, DIP, and DSi), and poor PAR winter conditions to calm and relatively lighted, but nutrient-limited (DSi < 2 μM, DIN < 1 μM, and DIP < 0.2 μM), and saline summer conditions (Figure 1 and Supplementary Figure 2). The second principal component (PC2, 18% of the total variance) was mainly driven by wind direction (both north and eastward winds) and SST, suggesting that SST increased as north and eastward winds increased. The temperature-salinity diagrams mainly discriminated water masses according to temperature (Supplementary Figure 3). The vertical structure of water masses also showed seasonal variations; the spring-summer water masses (from March to August) being saltier and colder at the bottom depth; autumn-winter conditions (from September to February) were reversed.
FIGURE 1
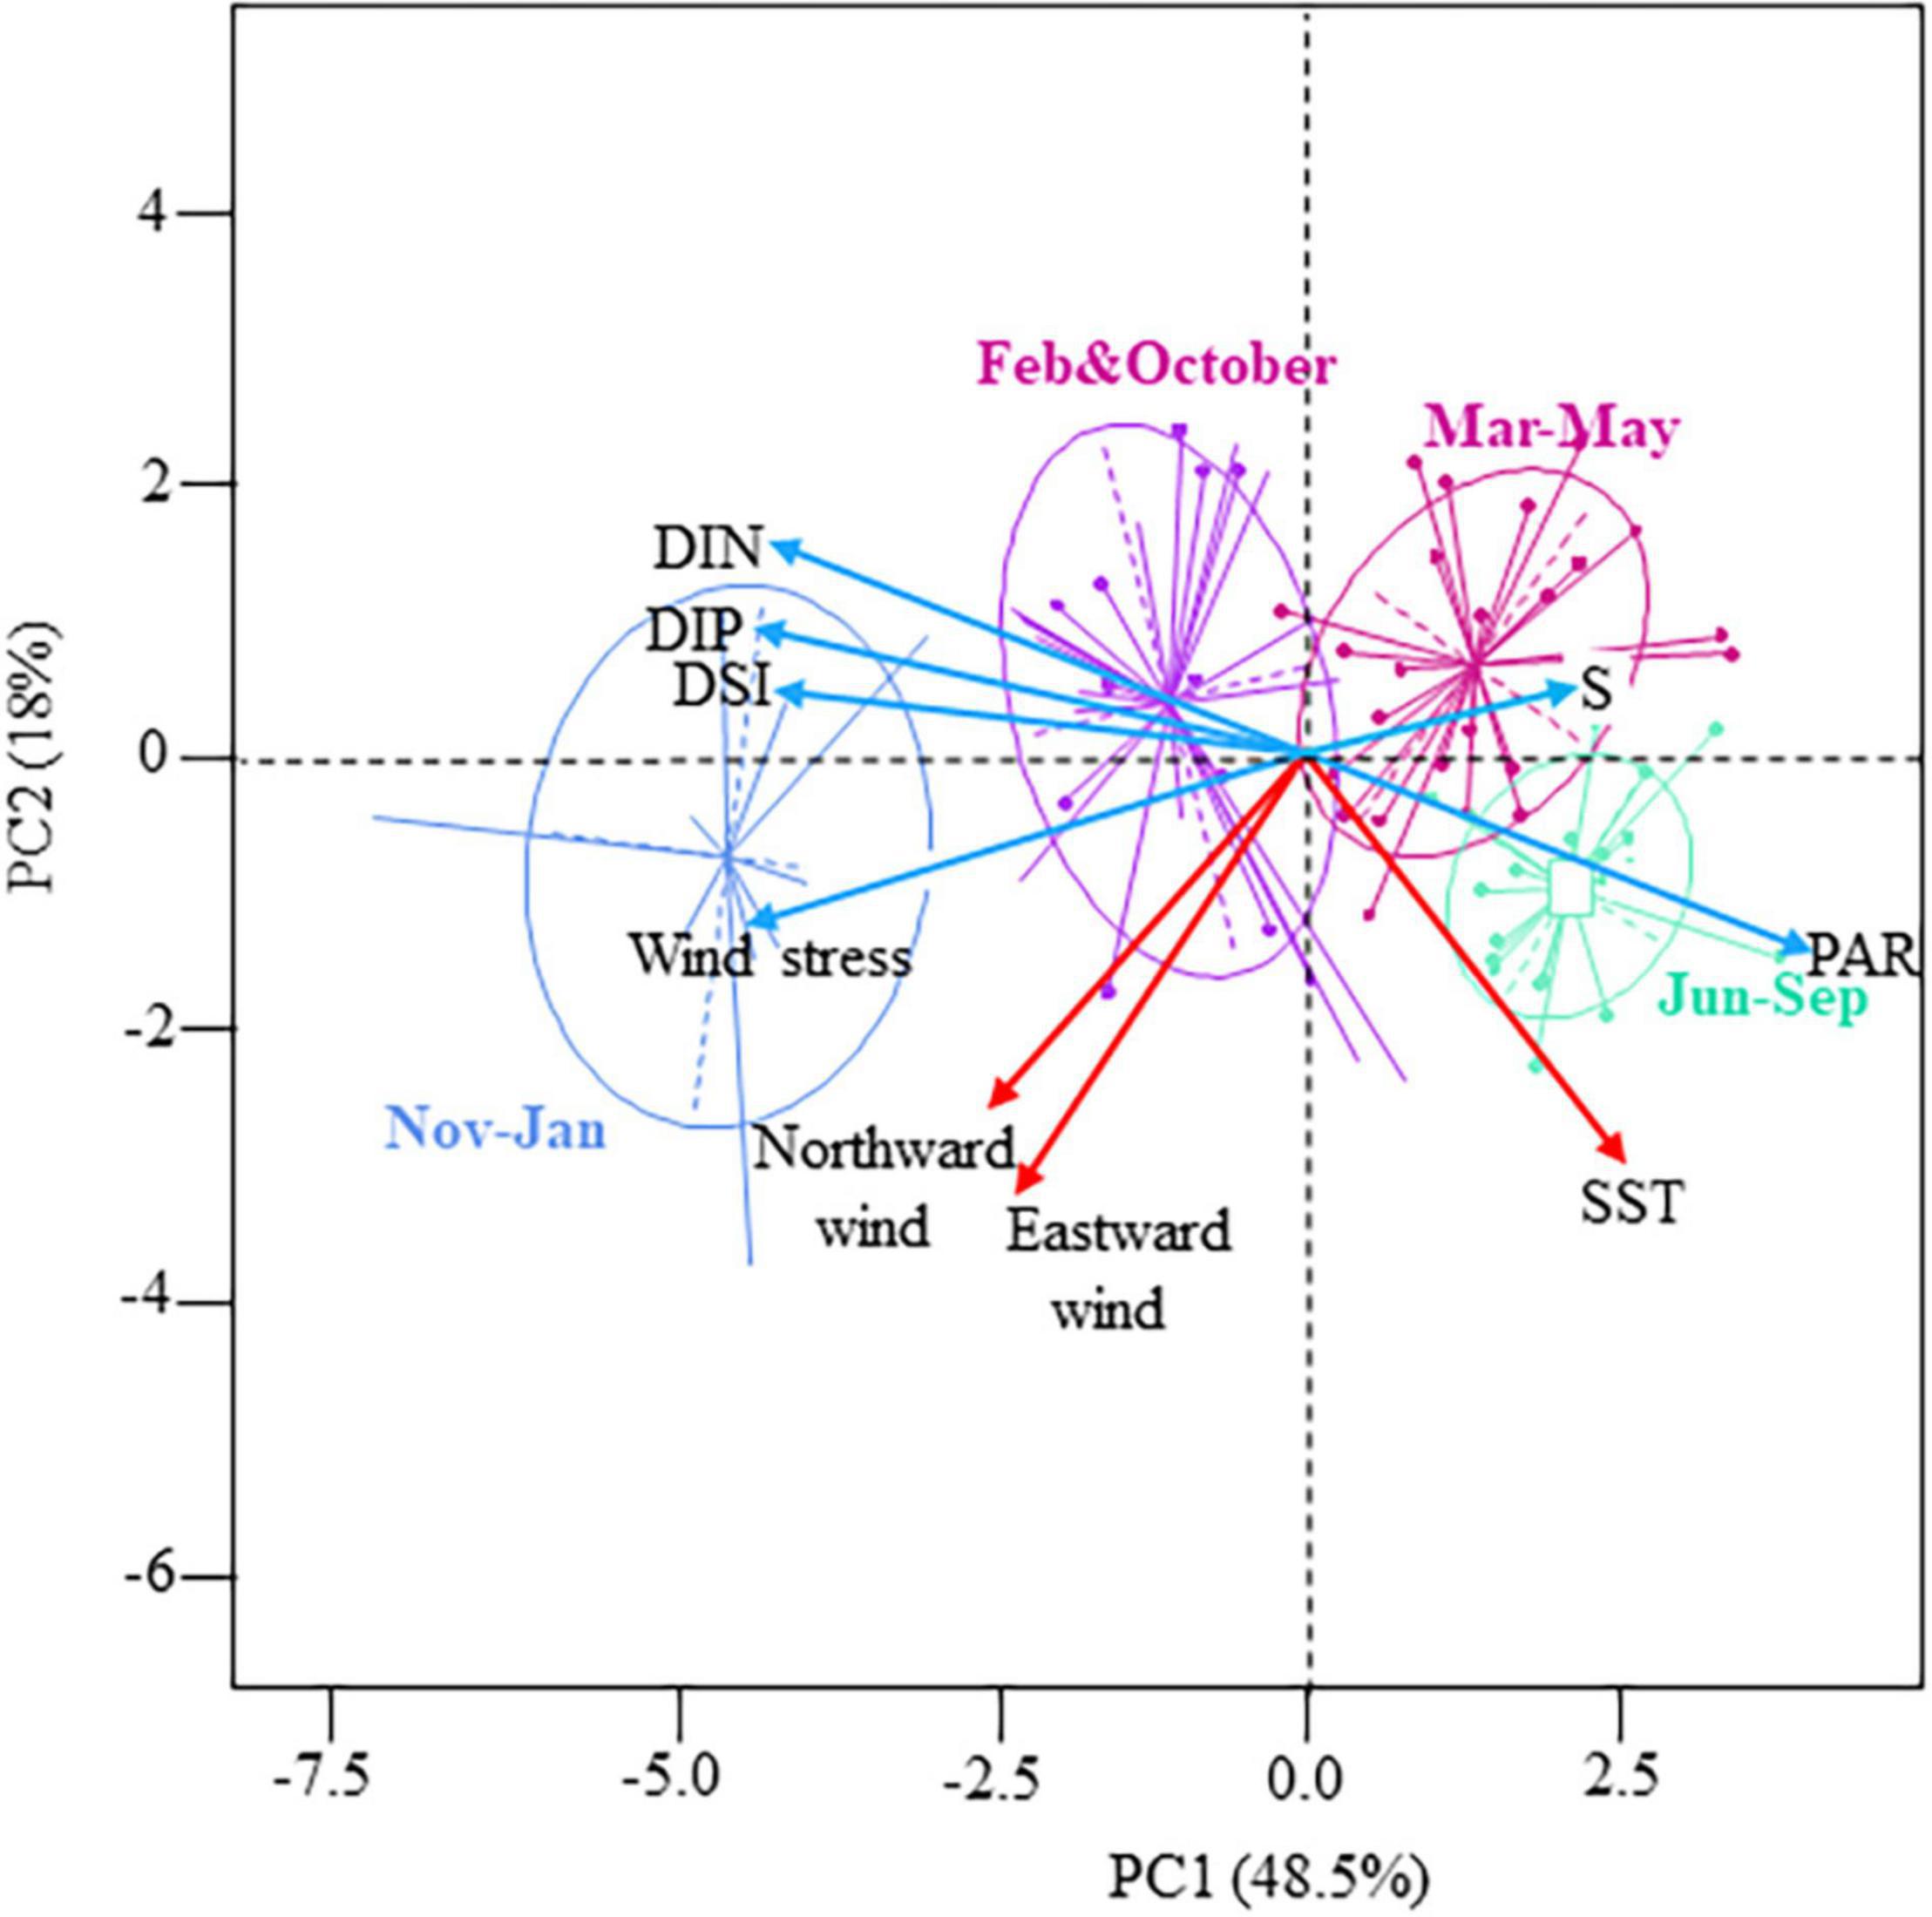
Figure 1. Principal Component Analysis showing the seasonal variations of the abiotic environment in coastal waters of the eastern English Channel over the period 2007–2013. Projection of the variables and of the observations (from January to December) on the factorial map (Eigenvalues are given into brackets, 66.5% of the total inertia). Blue and red arrows: significant Pearson correlation with the first (PC1) and second (PC2) principal components. Blue, purple, pink and green ellipses: Hierarchical Agglomerative Clustering (HAC) of the observations on the factorial map using the Ward’s linkage. Photosynthetic Active Radiation (PAR m–2 d–1), Salinity (S, n.u), Sea Surface Temperature (SST, °C), Dissolved Inorganic Nitrogen (DIN, μM), Phosphorus (DIP, μM), Silica (DSi, μM), Northward and Eastward winds (m s–1).
Phytoplankton biomass was mainly composed of diatoms, except when Phaeocystis colonies prevailed (from March to mid-May, Figure 2A). Zooplankton biomass was mainly composed of copepods, except during the seasonal outburst of the meroplankton that was mainly composed of Echinodermata (in May, mainly Pluteus larvae, Figure 2B). While a slight decrease was observed during the peak of Phaeocystis, the biomass of diatoms followed the same seasonal dynamics as protozooplankton (sum of heterotrophic dinoflagellates and ciliates) and copepods (Figures 3A–D). Protozooplankton and copepod biomass progressively increased from winter months to May–June (Figures 3C,D), before decreasing. The C/Chla ratio showed strong seasonal variations, with maxima in April–May and minima in winter (Figure 3E).
FIGURE 2
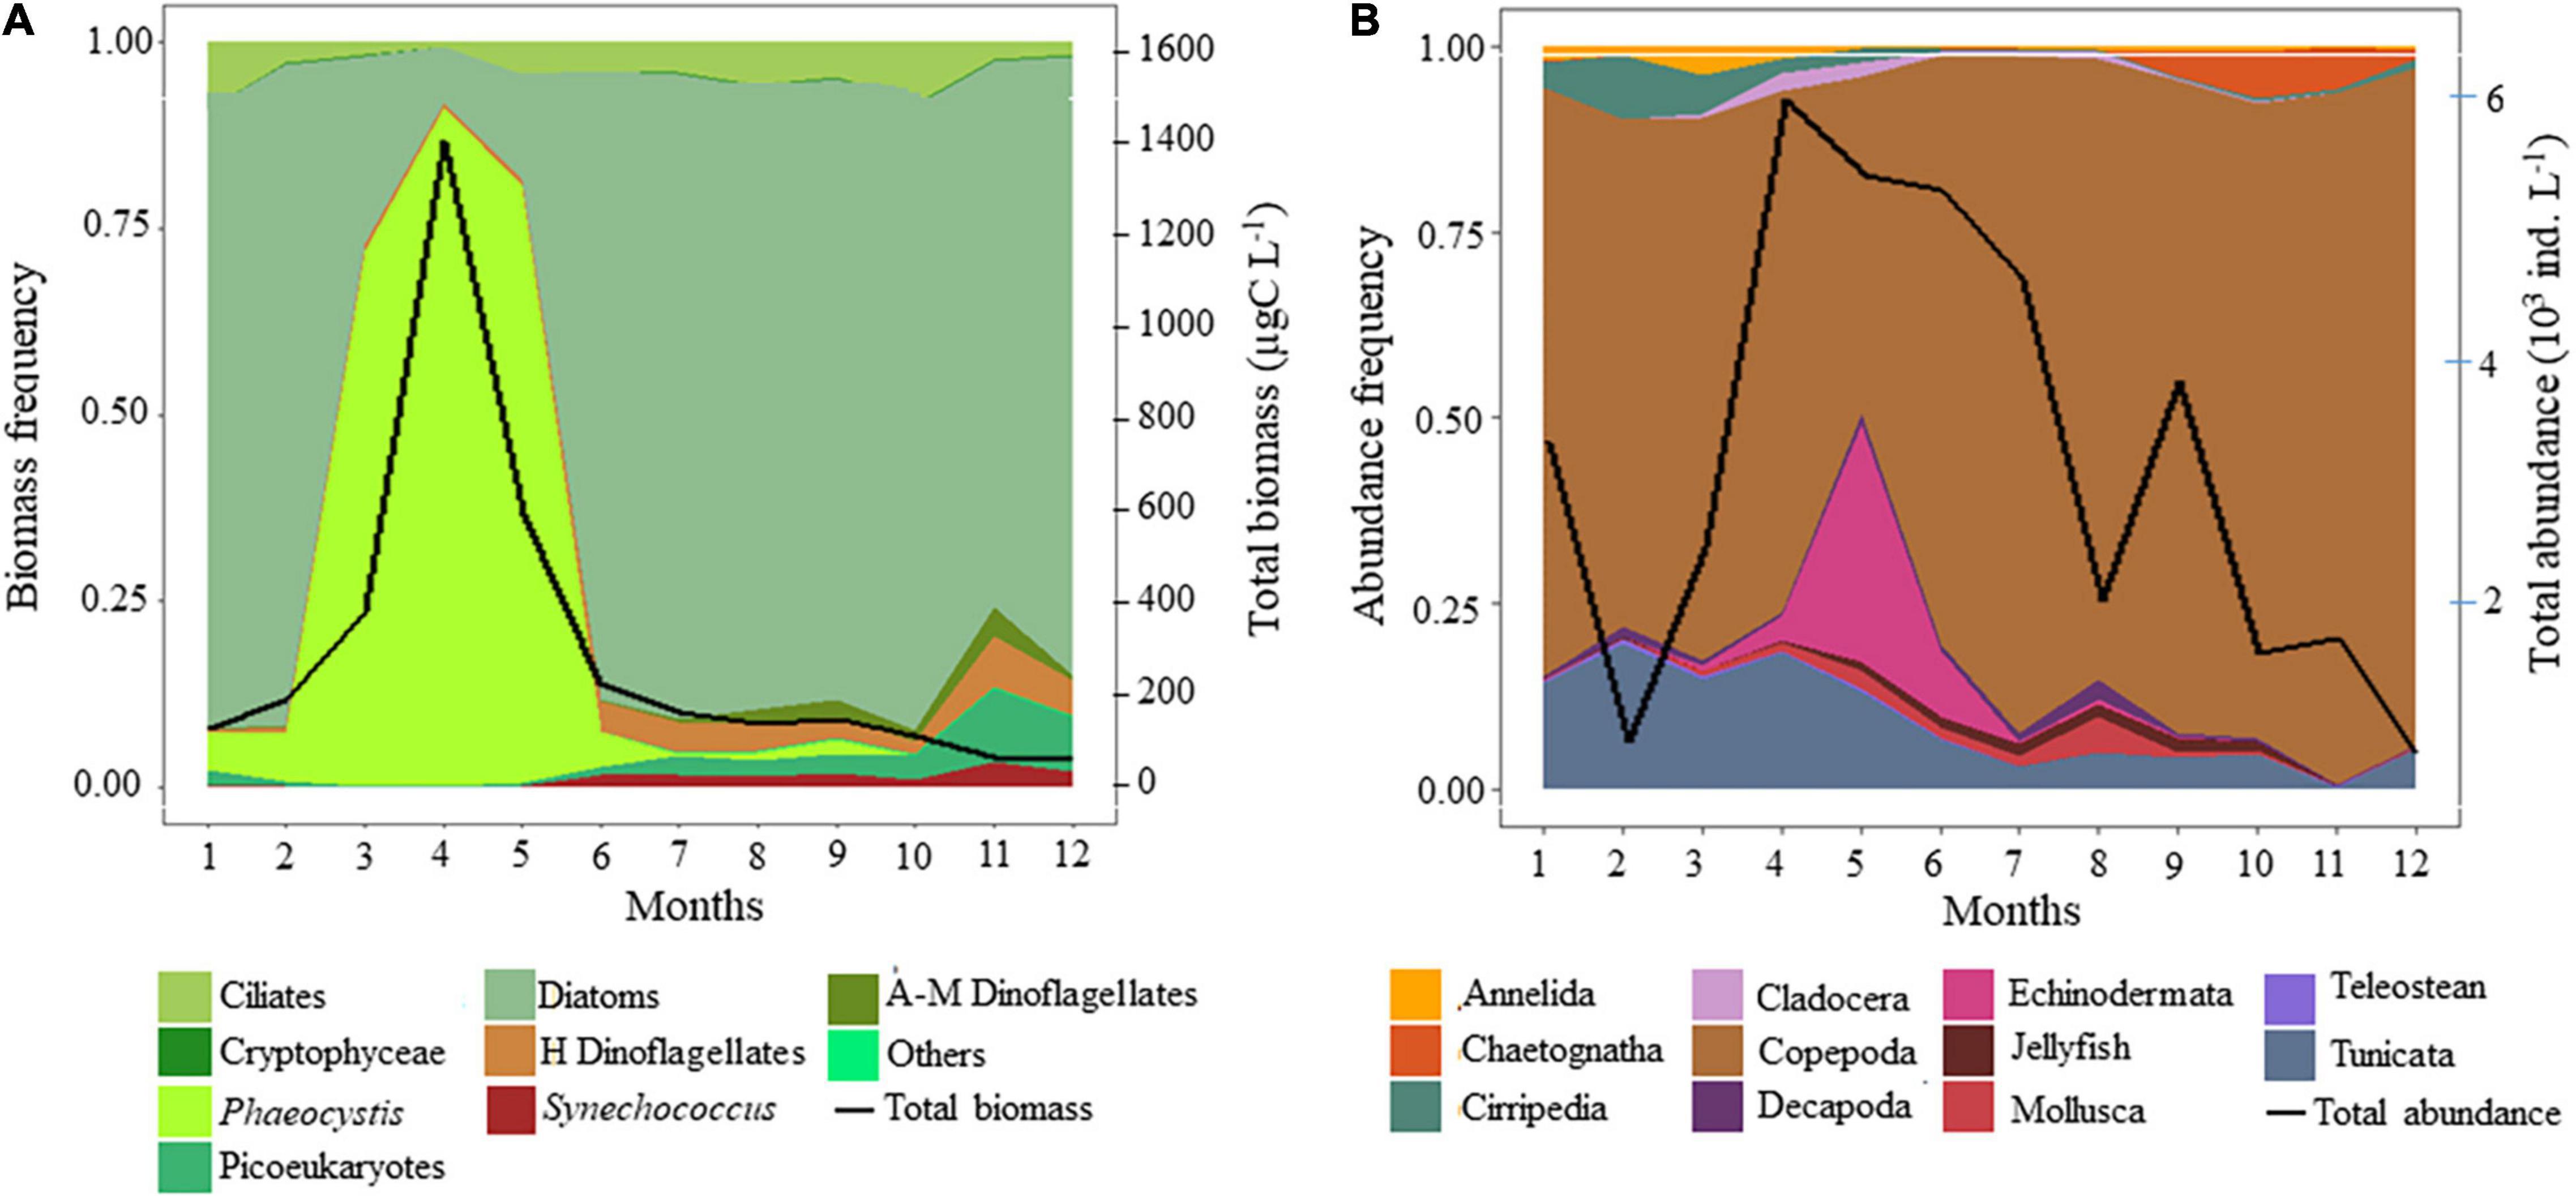
Figure 2. Seasonal variations in panel (A) phytoplankton composition (carbon biomass frequency) and total phytoplankton biomass (black line, μgC L–1), and (B) zooplankton composition (abundance frequency) and total zooplankton abundance (black line,103 ind. L–1). A-M, Auto- Mixotrophic; H, Heterotrophic. Teleostean included fish larvae and eggs. Jellyfish included Cnidaria and Ctenaria.
FIGURE 3
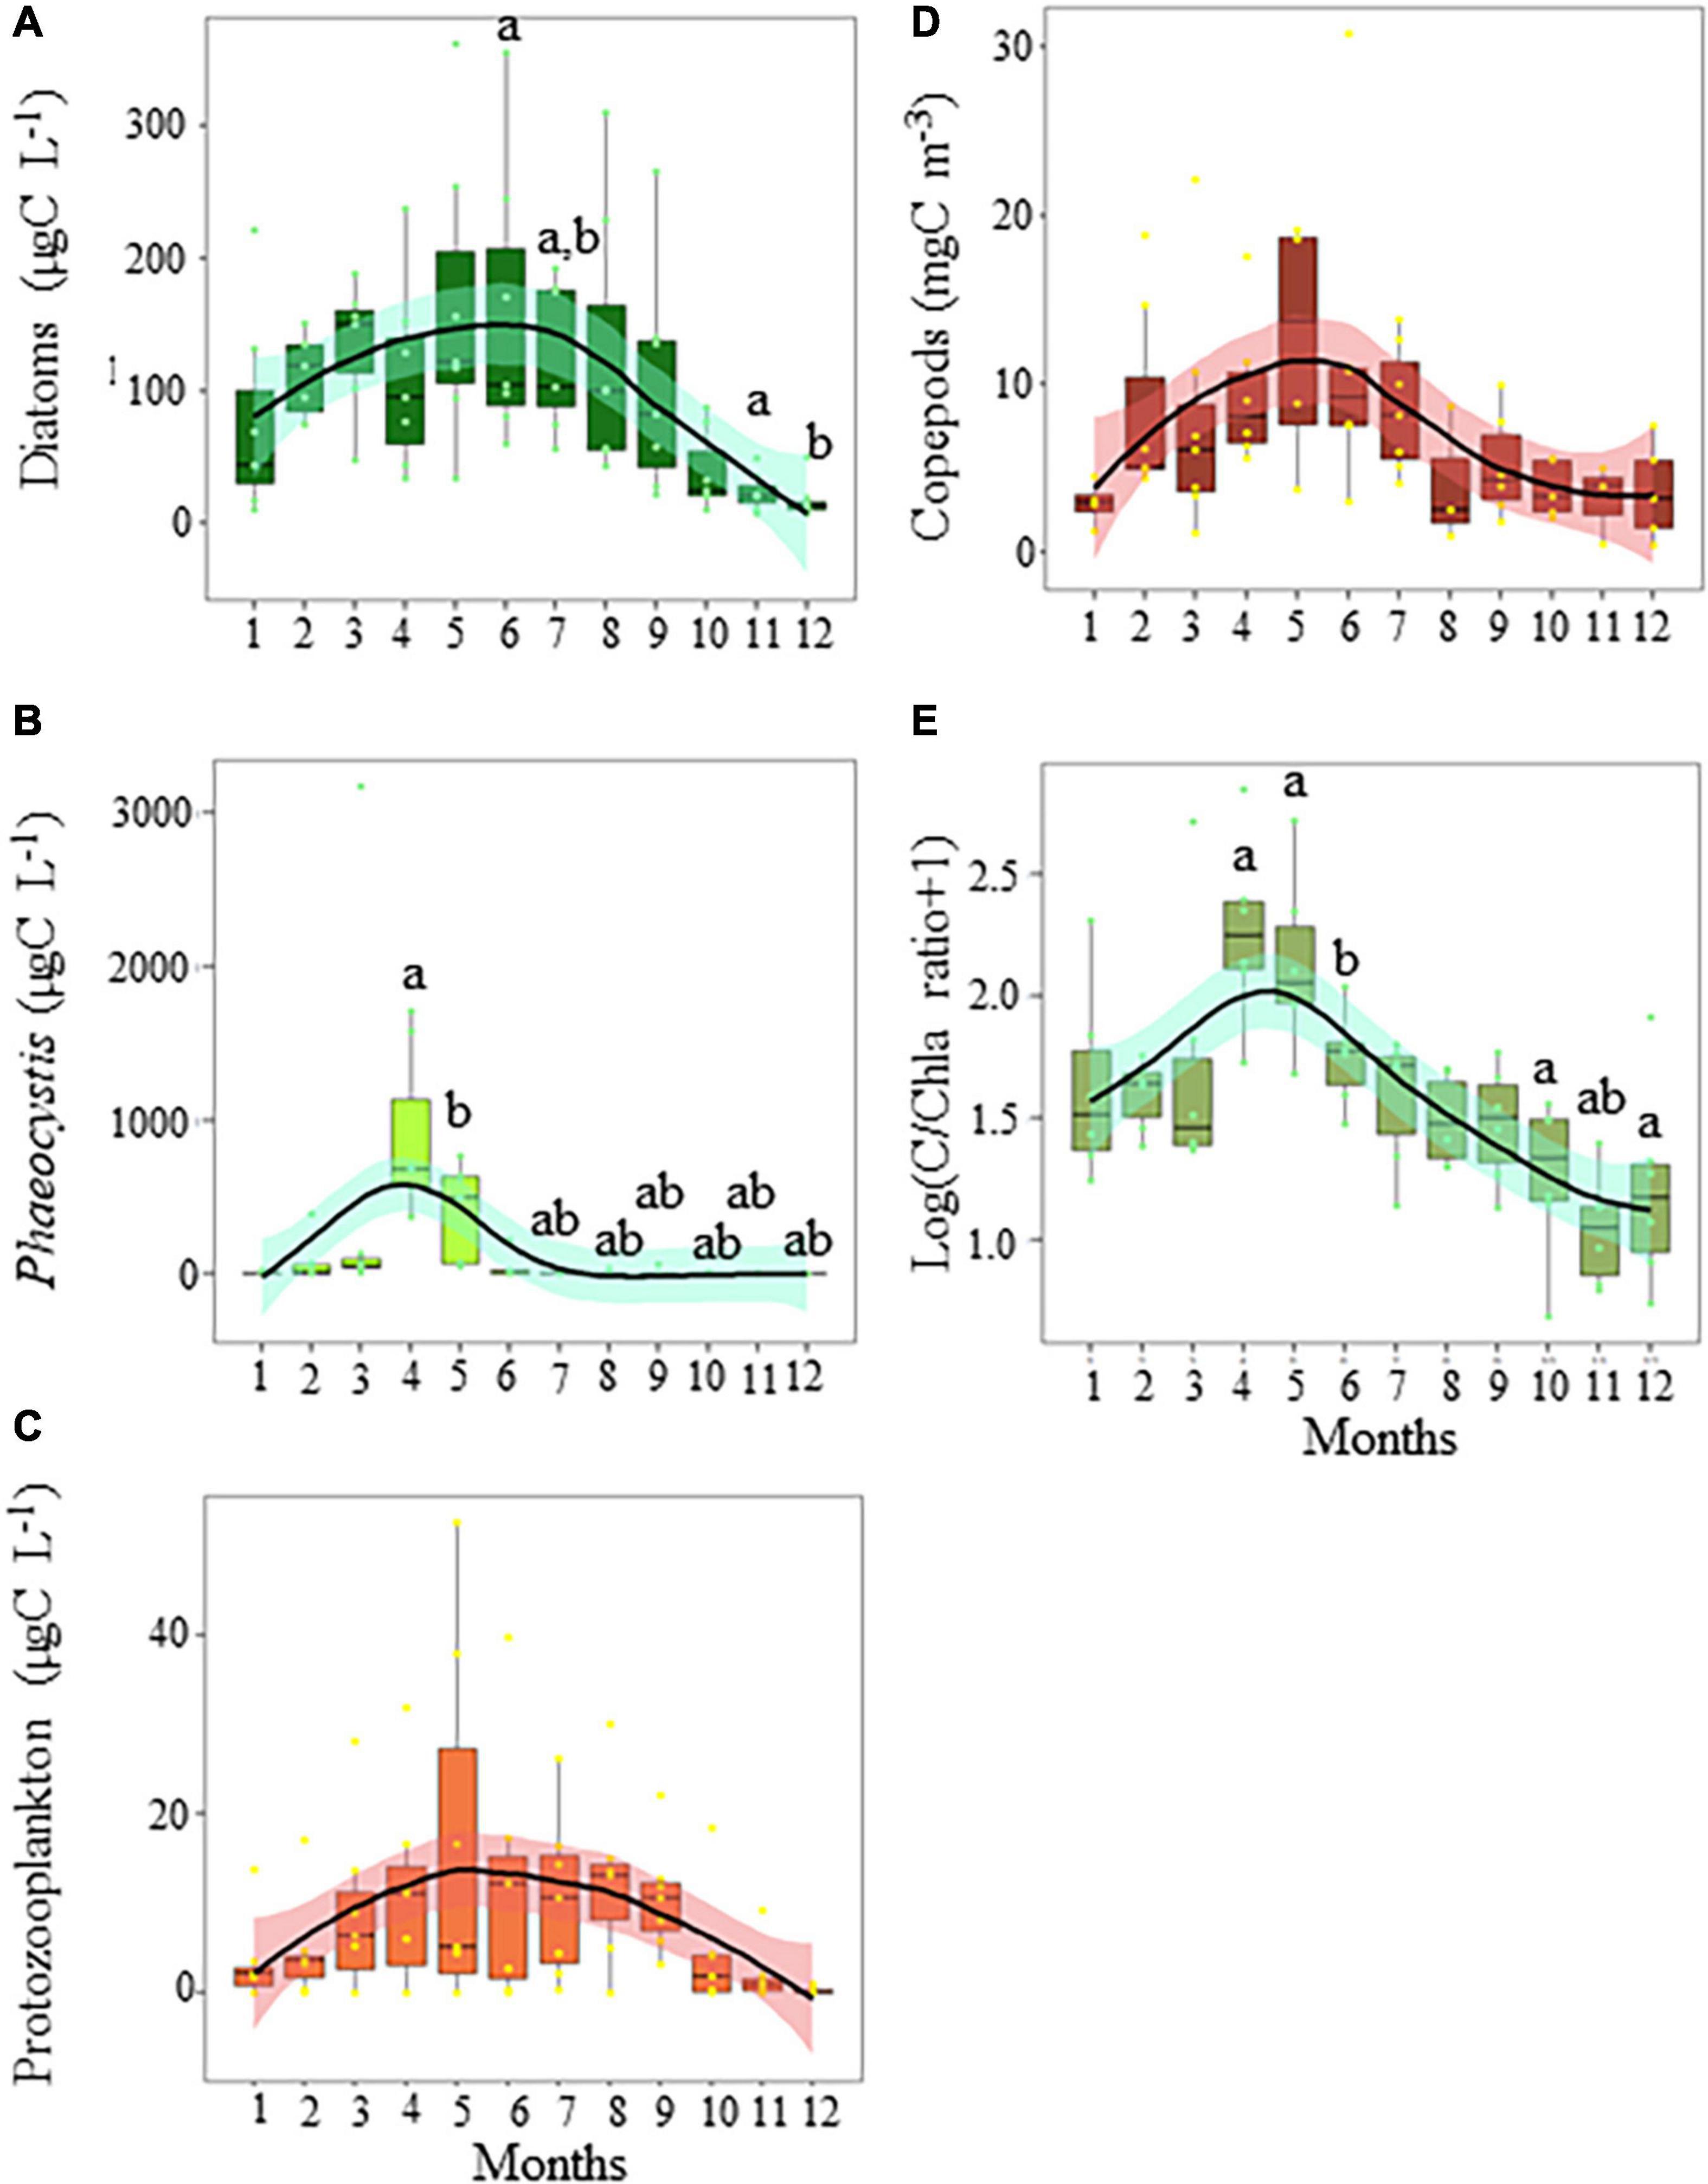
Figure 3. Seasonal variations in the biomass (mgC L–1) of panel (A) diatoms, (B) Phaeocystis, (C) protozooplankton (ciliates and dinoflagellates), (D) copepods (mgC m–3), and (E) the C/Chla ratio in coastal waters of the eastern English Channel over the period 2007–2013. Black horizontal line inside box: median; box: first to third quartiles; whiskers: 1.5 times the interquartile range (IQR); dots: monthly data including outliers (>1.5 times IQR). The labels a and b show significant differences between months (p = 0.05, Nemenyi test). The solid line and ribbon represent LOESS smoothing and the 95% confidence interval, respectively.
Functional Structure and Ecological Specialization of the Diatom and Copepod Communities
Seasonal variations in the functional structure and ecological specialization of the diatom community characterized with LOESS over the period 2007–2013 (Supplementary Figures 4A,C,E,G,I,K,M,O and Supplementary Figures 5A,C,E,G,I,K) were similar to those obtained over the period 1996–2019 (Supplementary Figures 4B,D,F,H,J,L,N,P and 5B,D,F,H,J,L). However, Nemenyi tests revealed that monthly changes were more pronounced when using the 24-year time series. The PC1 of the PCoA (PCoA1; 51% of the total variance) (Figure 4A) suggested a seasonal shift in the functional structure and ecological specialization of diatom communities from the autumn fall winter to the spring period. This shift was characterized by a seesawing from communities exhibiting high silicification, low S/V ratio, presence of tychopelagic/benthic species, PAR specialization, and generalists relative to nutrient use, to more environmentally tolerant diatom communities (from May to July). During early spring and the Phaeocystis bloom period, communities exhibited an intermediate position (Figure 4A). The PC2 (PCoA2; 15% of the total variance) revealed that large-size diatom species with defense against predation prevailed from January to March and in October (Figure 4A). Although weakly associated with the first two principal components, we detected, for both time series, that CWM-MLD values peaked during the maximum of the Phaeocystis bloom (i.e., April; Supplementary Figures 4E,F).
FIGURE 4
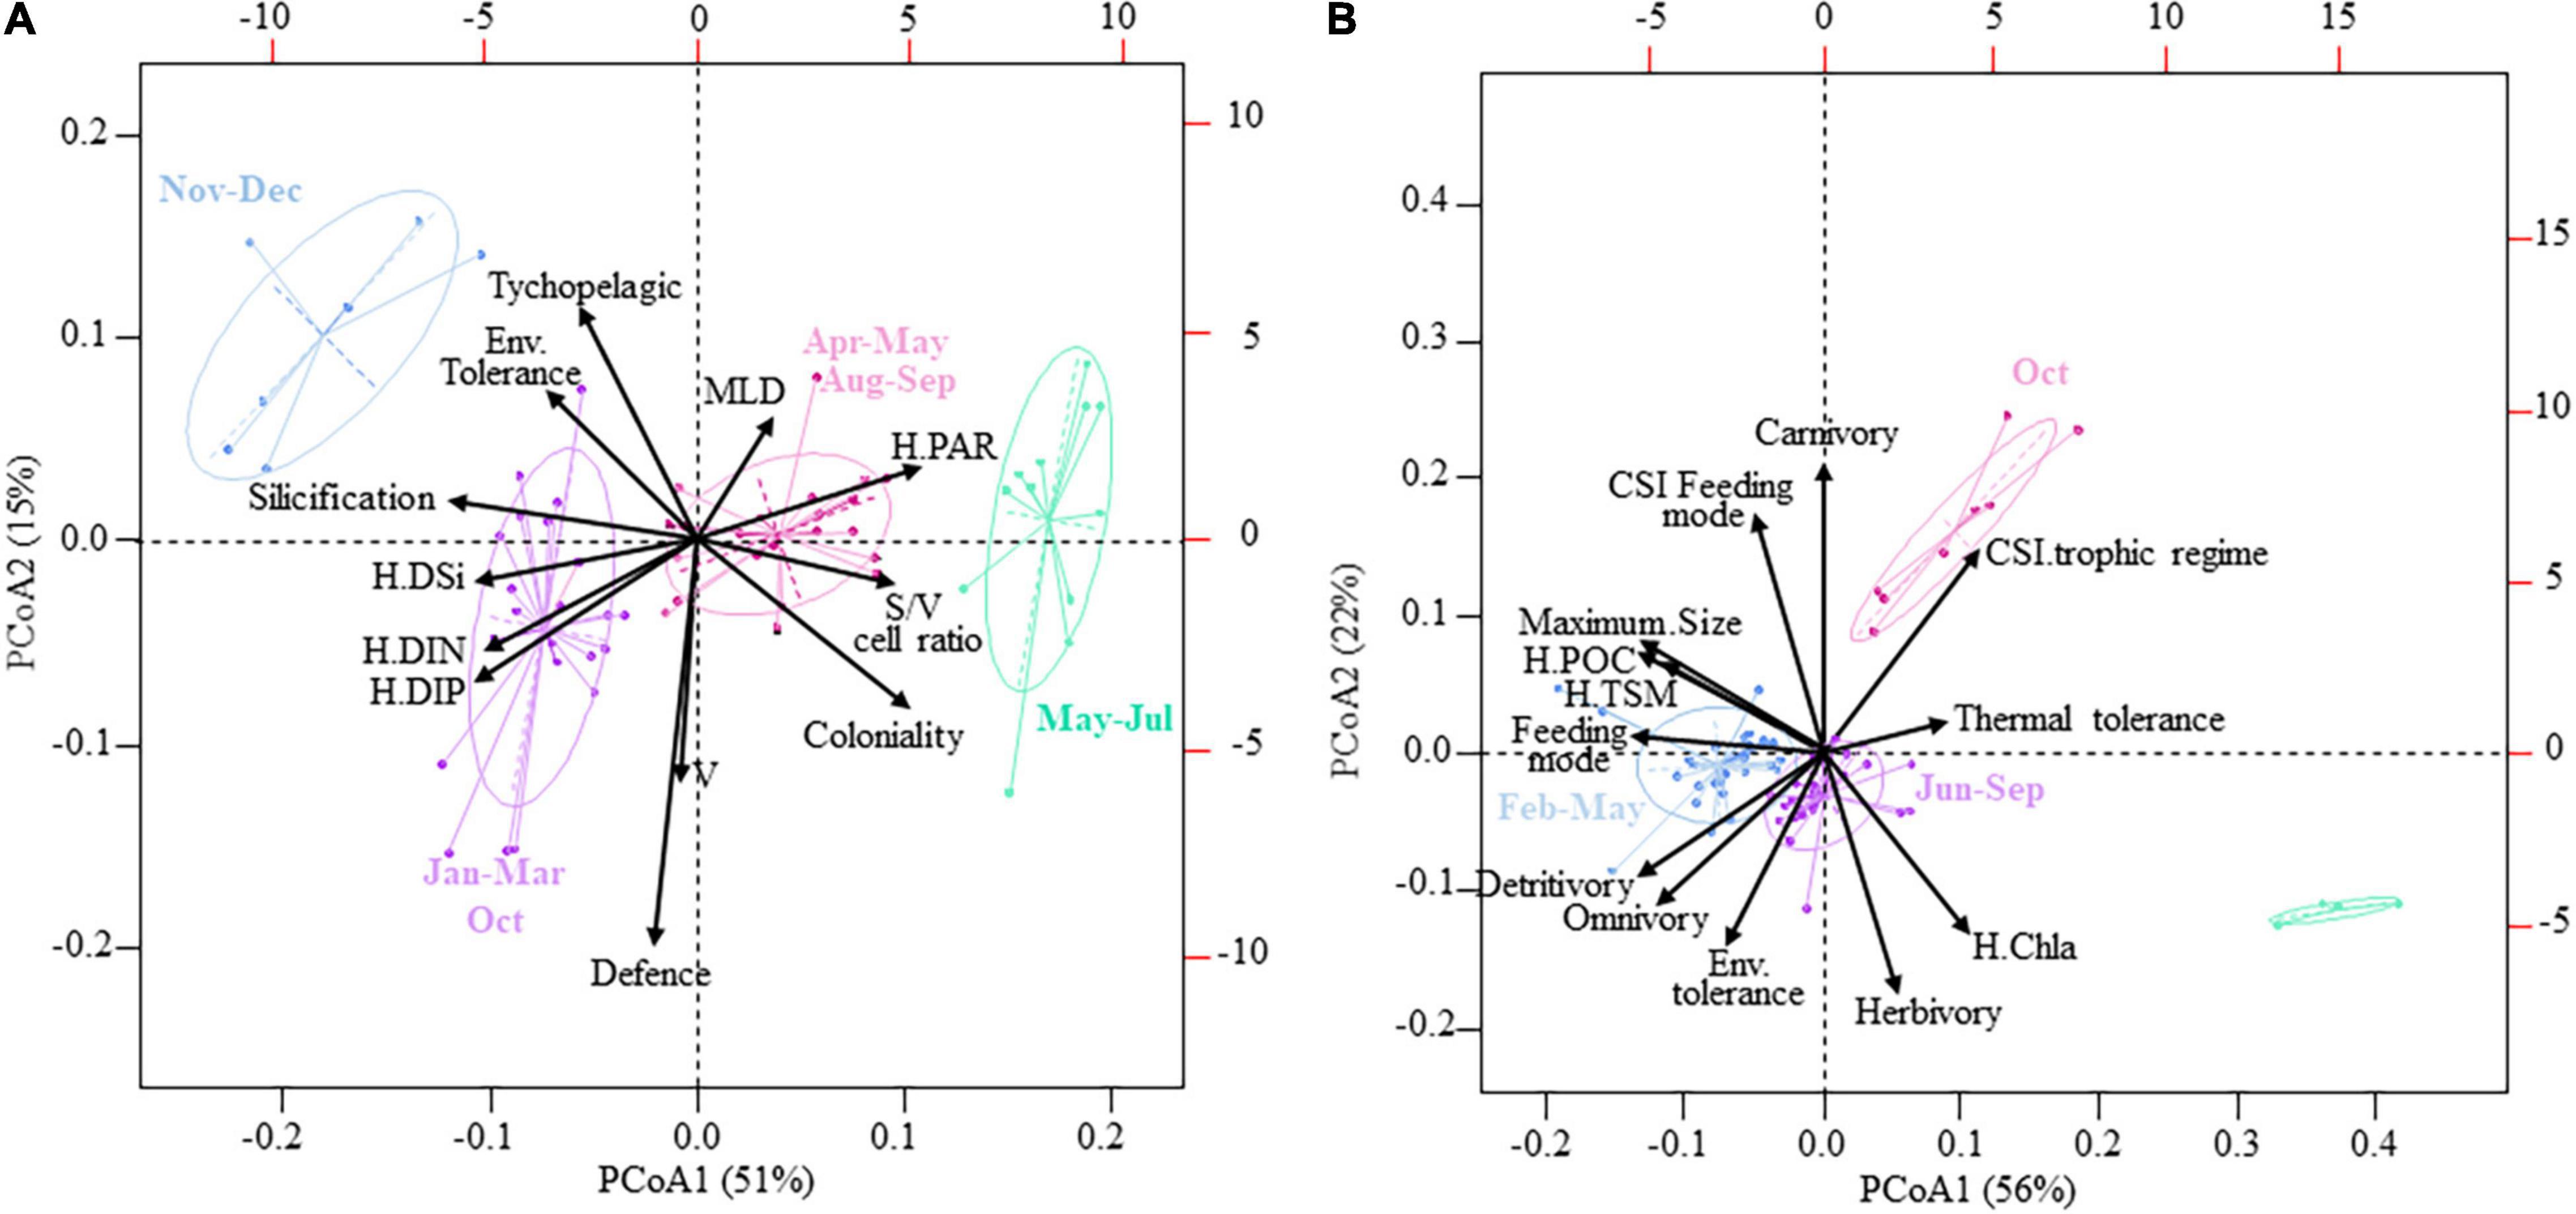
Figure 4. Principal coordinates analysis (PCoA) of the functional structure and ecological specialization of the (A) diatom and (B) copepod community in coastal waters of the eastern English Channel over the period 2007–2013. The percentage of the total variance explained by each axis is shown in parentheses. Months are grouped together following the results of a Hierarchical Agglomerative Clustering (HAC) using the Ward’s linkage and the two first coordinates of the PCoA. Each point represents a monthly averaged community sample. The ellipses show a 95% confidence level. H, niche breadth; PAR, Photosynthetic Active Radiation; DIN, DIP, DSi, Dissolved Inorganic Nitrogen and Phosphorous, and Silica; Chla, Chlorophyll a; S/V cell ratio, Surface to Volume cell ratio; MLD, Maximum Linear Dimension; Env. Tolerance, environmental tolerance; CSI, Community Specialization Index; TSM, Total Suspended Matter; POC, Particulate Organic Carbon. Thermal tolerance in panel (A) is not shown given its central position on the PCoA plane.
For copepods, the PCoA (the PCoA1 and PCoA2 explaining 56% and 22% of the total inertia, respectively, Figure 4B) showed that the communities were mainly composed, from February to May, of large omnivorous active feeders (i.e., high CWM-feeding mode values), omnivores with a relatively high propensity to detritivory and environmentally tolerant species, and generalists for TSM and POC. A contrasting pattern between the CWM-omnivorous and the CSI-trophic regime was detected. From June to September, communities were mainly composed of small and passive feeders with a low propensity to detritivory and specialists for both TSM and POC. In October, carnivorous copepods, with specialized feeding modes and specialized environmental requirements, dominated the community.
Accordingly, the CSIs of copepods for trophic regime and feeding mode had high values. Concerning the functional structure of the copepod community (Supplementary Figures 6A–M), significant monthly changes were only seen for maximum size (Supplementary Figure 6A) and feeding mode (Supplementary Figure 6B).
Species Richness and FD of Diatom and Copepod Communities
The annual cycle of diatom species richness exhibited a bimodal pattern (Figure 5A and Supplementary Figure 7A), with a peak in February–March and September–October. No significant monthly change was detected (Nemenyi test, p > 0.05). The annual cycle of copepod species richness was unimodal, peaking in August–September (Figure 5B). No monthly variation was detected between the volume of filtered seawater and copepod species richness (N = 96, r2 = 10–5, p > 0.05).
FIGURE 5
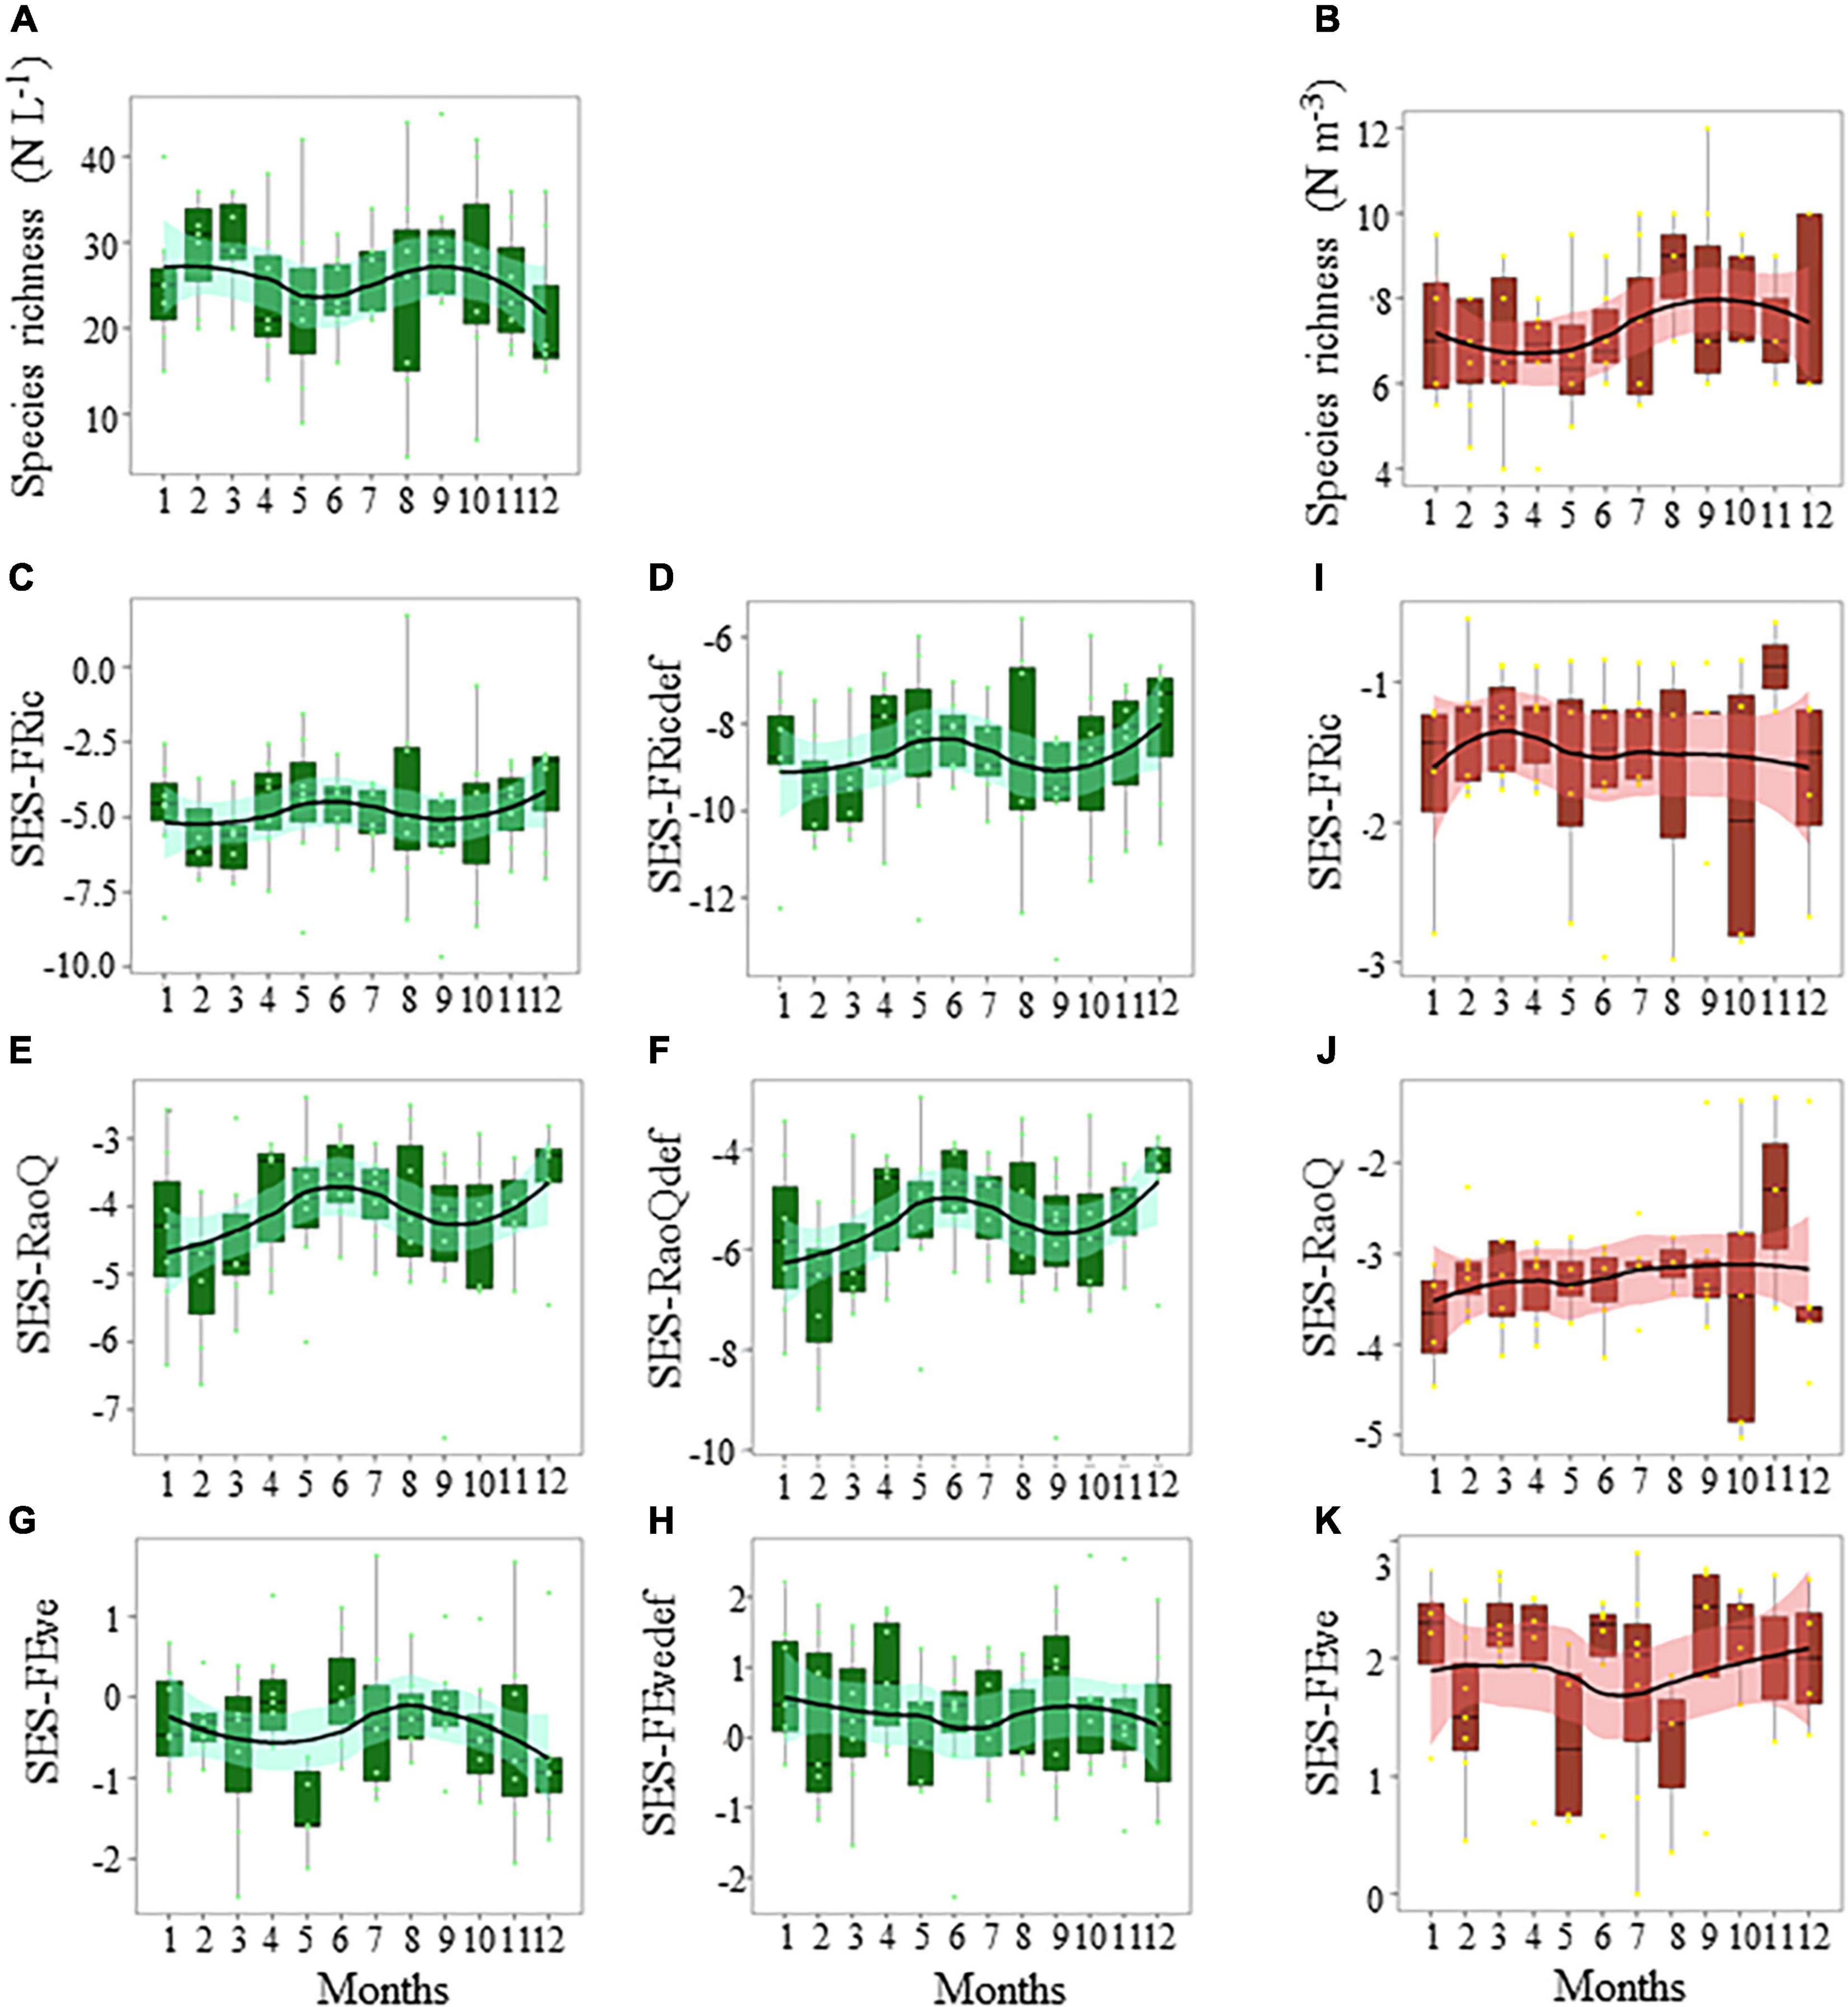
Figure 5. Seasonal variations in the panels (A,B) species richness, (C–E) functional richness (SES-Fric), (E,F,J) functional divergence (SES-RaoQ), and (G,H,K) functional evenness (SES-Feve) of the diatom (A–H, in green) and copepod (B,I–K, in red) community in coastal waters of the eastern English Channel over the period 2007–2013. Def: defence traits against predation. Black horizontal line inside box: median; box: first to third quartiles; whiskers: 1.5 times the interquartile range (IQR); dots: monthly data including outliers (>1.5 times IQR). The solid line and ribbon represent LOESS smoothing and the 95% confidence interval. No difference between months (p > 0.05, Nemenyi test) was found between boxes for any of the variables.
Patterns of FD of the diatom community (Figures 5C–H, refer Supplementary Table 5 and “diatom.defense.traits” in Supplementary Data for more details on the calculation), differed among functional indices, independently of the sampling period (Supplementary Figures 7B–G). FRic (SES-FRic, Figures 5C,D and Supplementary Figures 7B,C) and divergence (SES-RaoQ, Figures 5E,F and Supplementary Figures 7D,E) for resource use and predation avoidance were lower than expected by chance. FEve values (SES-FEve, Figures 5G,H and Supplementary Figures 7F,G) were also not different from those expected by chance. The SES-FRic and SES-RaoQ were significantly negatively correlated to species richness for both resource use and predation avoidance (SES-FRic: r = −1, p < 0.001 and r = −0.98, p < 0.001, respectively; SES-RaoQ: r = −0.78, p < 0.001, r = −0.77, p < 0.001, respectively). SES-FEve was not correlated with species richness (r = 0.21, p > 0.05 and r = 0.01, p > 0.05, respectively).
For copepods, the SES-FRic (Figure 5I) and SES-RaoQ (Figure 5J) were also significantly negatively correlated with species richness, but to a lesser extent (r = −0.43, p < 0.001, r = −0.34, p < 0.001, respectively). Omnivory and herbivory, because of their respective high significant correlation with detritivory (r = 0.9, p < 0.001) and carnivory (r = −0.91, p < 0.001), were discarded from the calculation. The SES-FRic (Figure 5I) values for copepods were not different from those expected by chance. SES-RaoQ (Figure 5J) and SES-FEve (Figure 5K) values were mostly lower and higher, respectively, than expected by chance. FD indices did not show seasonal patterns (e.g., note the large 95% confidence intervals of the LOESS fits in Figures 5I–K and Supplementary Figure 6A–M).
Relationships Between the Functional Structure, Ecological Specialization, and FD, and the Abiotic and Biotic Environment
Co-inertia analysis showed a significant coupling (n = 63, RV = 0.49, p = 10–3) between the structure of diatom communities and abiotic/biotic conditions (Figures 6A,B, Supplementary Figures 8A,B, and Supplementary Table 6A). A seasonal pattern was delineated by the COIA (Supplementary Figures 8A,B). Although all environmental parameters were significant in structuring the seasonality of diatom communities, some were more important than others (Supplementary Table 6A). The first COIA axis (explaining 86% of the total inertia, Figure 6A) showed that diatom communities, composed predominantly of slightly silicified species, with a relative high S/V cell ratio, and the ability to form colonies, were associated to calm weather conditions and more saline seawater with relatively higher PAR, but low nutrients. Diatom communities, with mainly specialist species for nutrients but generalists for PAR, were also sensitive to environmental variations (relatively low “Tol” values); slightly silicified species bloomed later in the year. According to the second COIA axis (8% of the total inertia; Figure 6A), most diatoms with high defense levels against predation and DIN generalists were associated with colder seawater, rich in Phaeocystis biomass and characterized by a high C/Chla ratio, and large-bodied generalist omnivore copepod species. Under such conditions, diatom biomass was maximal. The third COIA axis (3% of the total inertia; Figure 6B) showed that species-rich diatom communities, characterized by the dominance of small MLD species, were associated with copepod communities dominated by specialist species. The SES-FRic and SES-RaoQ of the diatom community were the lowest for both resource use and predation avoidance (Figure 6B).
FIGURE 6
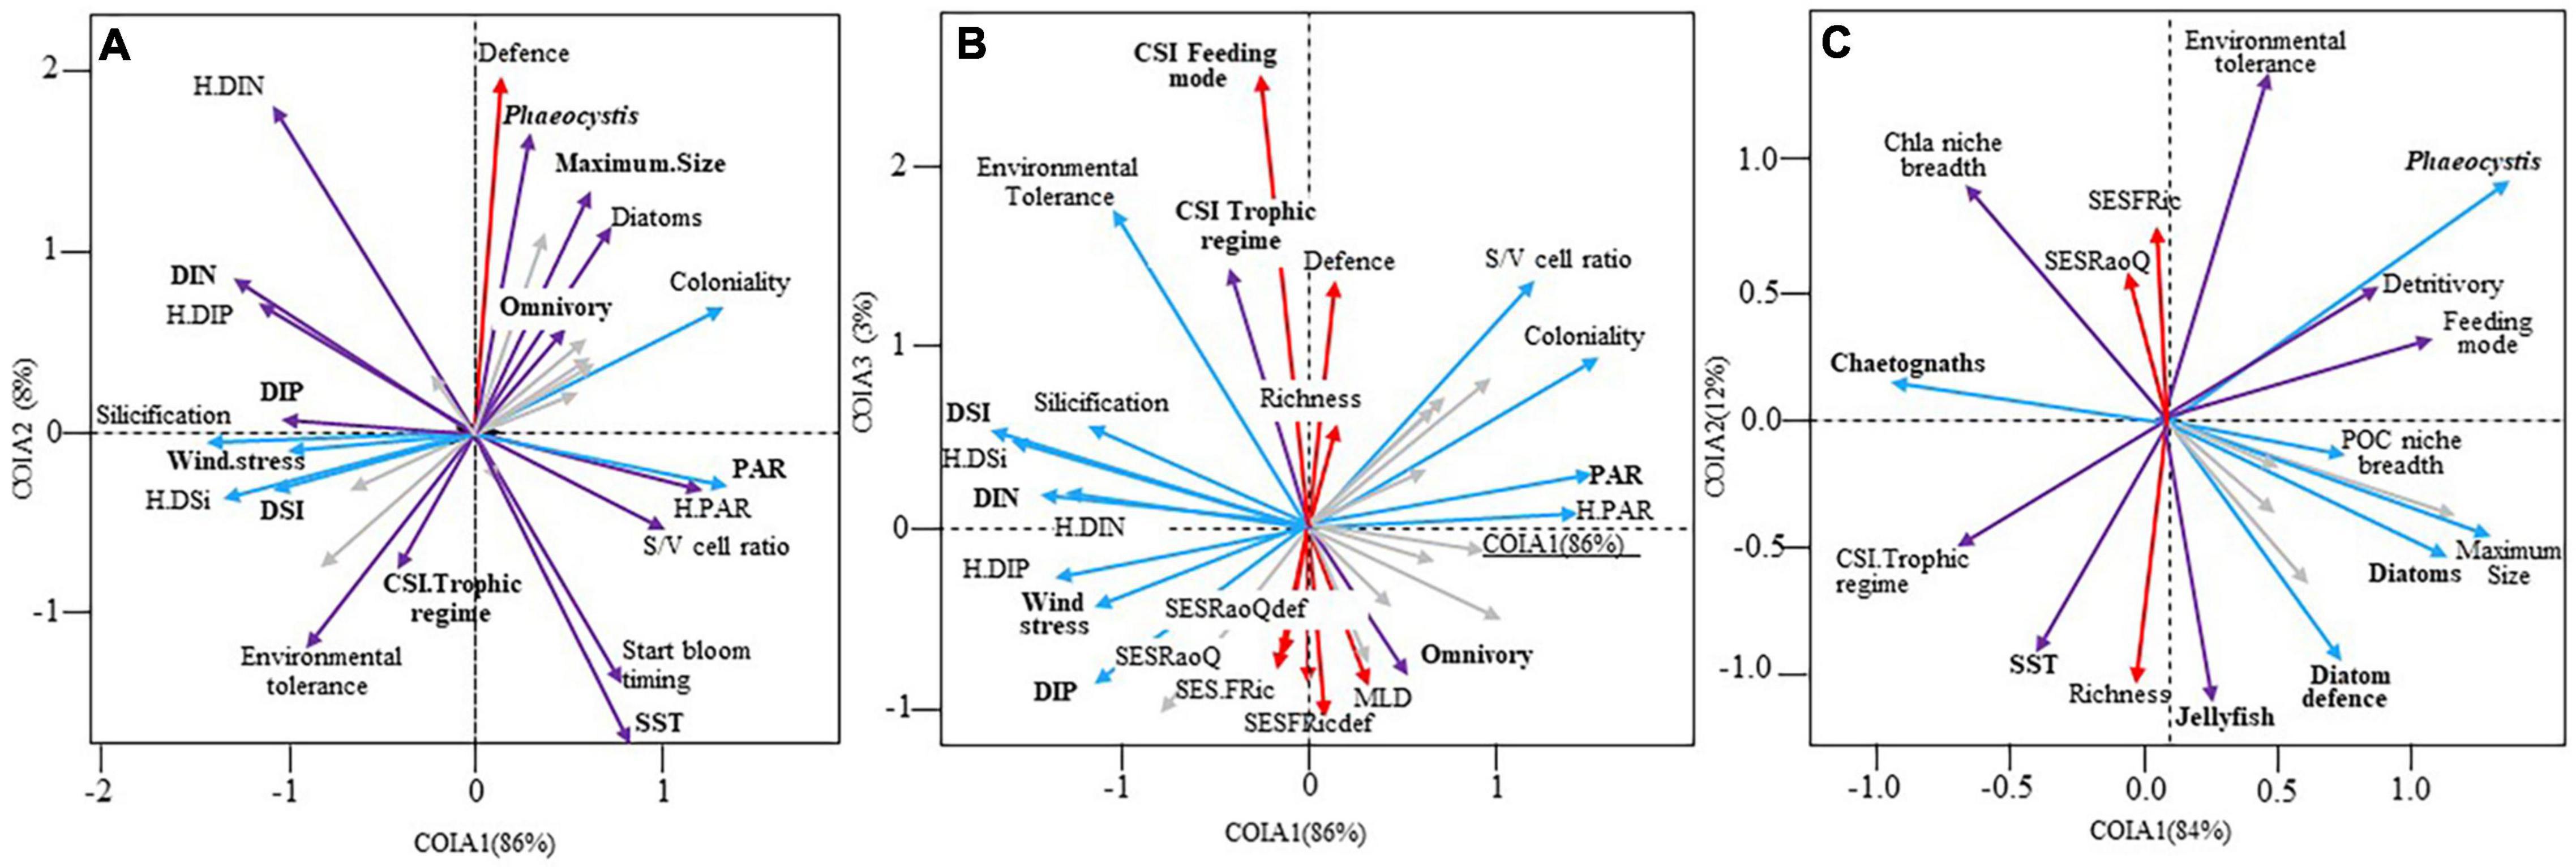
Figure 6. Projection of the environmental variables, species richness, functional structure, ecological specialization and functional diversity of (A,B) diatoms (N = 63, RV = 0.49, p = 10–3) and (C) copepods (N = 63, RV = 0.36, p = 10–3) on the factorial maps (A: 1–2, B: 1–3 and C: 1–2) of the co-inertia analysis performed on the diatom and copepod community in coastal waters of the eastern English Channel over the period 2007–2013. Bold labels: “environmental” variables. Only the variables that contribute the most to the construction of the axes are labelled (see Supplementary Table 6 for details). Gray arrows: no or low (r < 0.5) significant Pearson correlation between the variables and the first (blue arrows), second (red arrows) or both first and second or third (purple arrows) co-inertia axes. PAR, Photosynthetic Active Radiation; DIN, DIP, DSi, Dissolved Inorganic Nitrogen, Phosphorous, and Silica; SST, Sea Surface Temperature; S/V ratio, Surface to Volume cell ratio; MLD, Maximum Linear Dimension; CSI, Community Specialization Index; SES-FRic, the functional richness, SES-RaoQ, the functional divergence; def., defence against predation.
The coupling strength between functional structure (i.e., the CWMs), ecological specialization (i.e., environmental tolerance and niche breadth), and FD (SES-RaoQ and SES-FRic) of copepods, and environmental conditions (refer section “Materials and Methods”) was low but significant (n = 63, RV = 0.36, p = 0.001, Figure 6C). The seasonality of the coupling was unclear (Supplementary Figure 8C). The first co-inertia axis (explaining 84% of the total inertia) revealed that large, active-feeding, and omnivore copepod species (i.e., low CSI-trophic regime values) were associated with relative calm weather conditions, more saline Phaeocystis-rich waters, characterized by higher proportions of diatoms with defense levels against predation (Figure 6C and Supplementary Table 6B), and relative high abundance of jellyfish and fish larvae, but low abundance of chaetognaths. Copepods were tolerant to environmental fluctuations, with a propensity to detritivory. The second co-inertia axis (12% of the total inertia) exhibited that species-rich copepod communities were mainly composed of passive-feeding and trophic specialist species (i.e., high CSI-trophic regime values) with a low propensity to detritivory. Copepod species were also sensitive to environmental variations, especially under warm conditions and a high protozooplankton and jellyfish biomass (Figure 6C); this coincides with the lowest SES-FRic and SES-RaoQ values occurring in the copepod communities.
Variation partitioning analysis (VP, Figure 7A) exhibited that seasonal variations of the functional structure and ecological specialization of the diatom and copepod communities were not related to seasonal changes in environmental conditions, as shown by the high residual values. It was detected that the local environment contributed the most to the explained variance (i.e., 49%) in the functional structure and ecological specialization of the diatom community (adjusted r2 = 0.18, p = 0.001, i.e., 18% of the total variations of the diatom community), followed by hydrometeorological features (3%, p = 0.001) and the interaction between the local environment and hydrometeorological features is 16% (Figure 7A). The variations in the structure of the diatom community were also explained, but to a lesser extent, by the Phaeocystis bloom (1%, p = 0.001), predator biomass, and size (1%, p = 0.001), and their interactions (2%). The Phaeocystis bloom was the most contributing process to the functional structure and ecological specialization of the copepod community (15%, p = 0.001, Figure 7B). Hydrometeorological features (5%, p < 0.05) and their interaction with the Phaeocystis bloom (4%), and the interaction between the local environment and predators (3%), played a minor role. In contrast to the functional structure and ecological specialization of diatom and copepod communities, the proportion of unexplained variance was low (3%) for diatom species richness. Diatom species richness was mainly explained by the convergence of a combination of traits: SES-RaoQ decreased as species richness decreased (92% of the total variations in diatom species richness, p = 0.001, Figure 7C). As for the functional structure and ecological specialization, most of the variations of copepod species richness remained unexplained (69%), and the most contributing drivers are both the convergence of a combination of traits (Figure 7D) and its indirect influence through interaction with the local environment (27%).
FIGURE 7
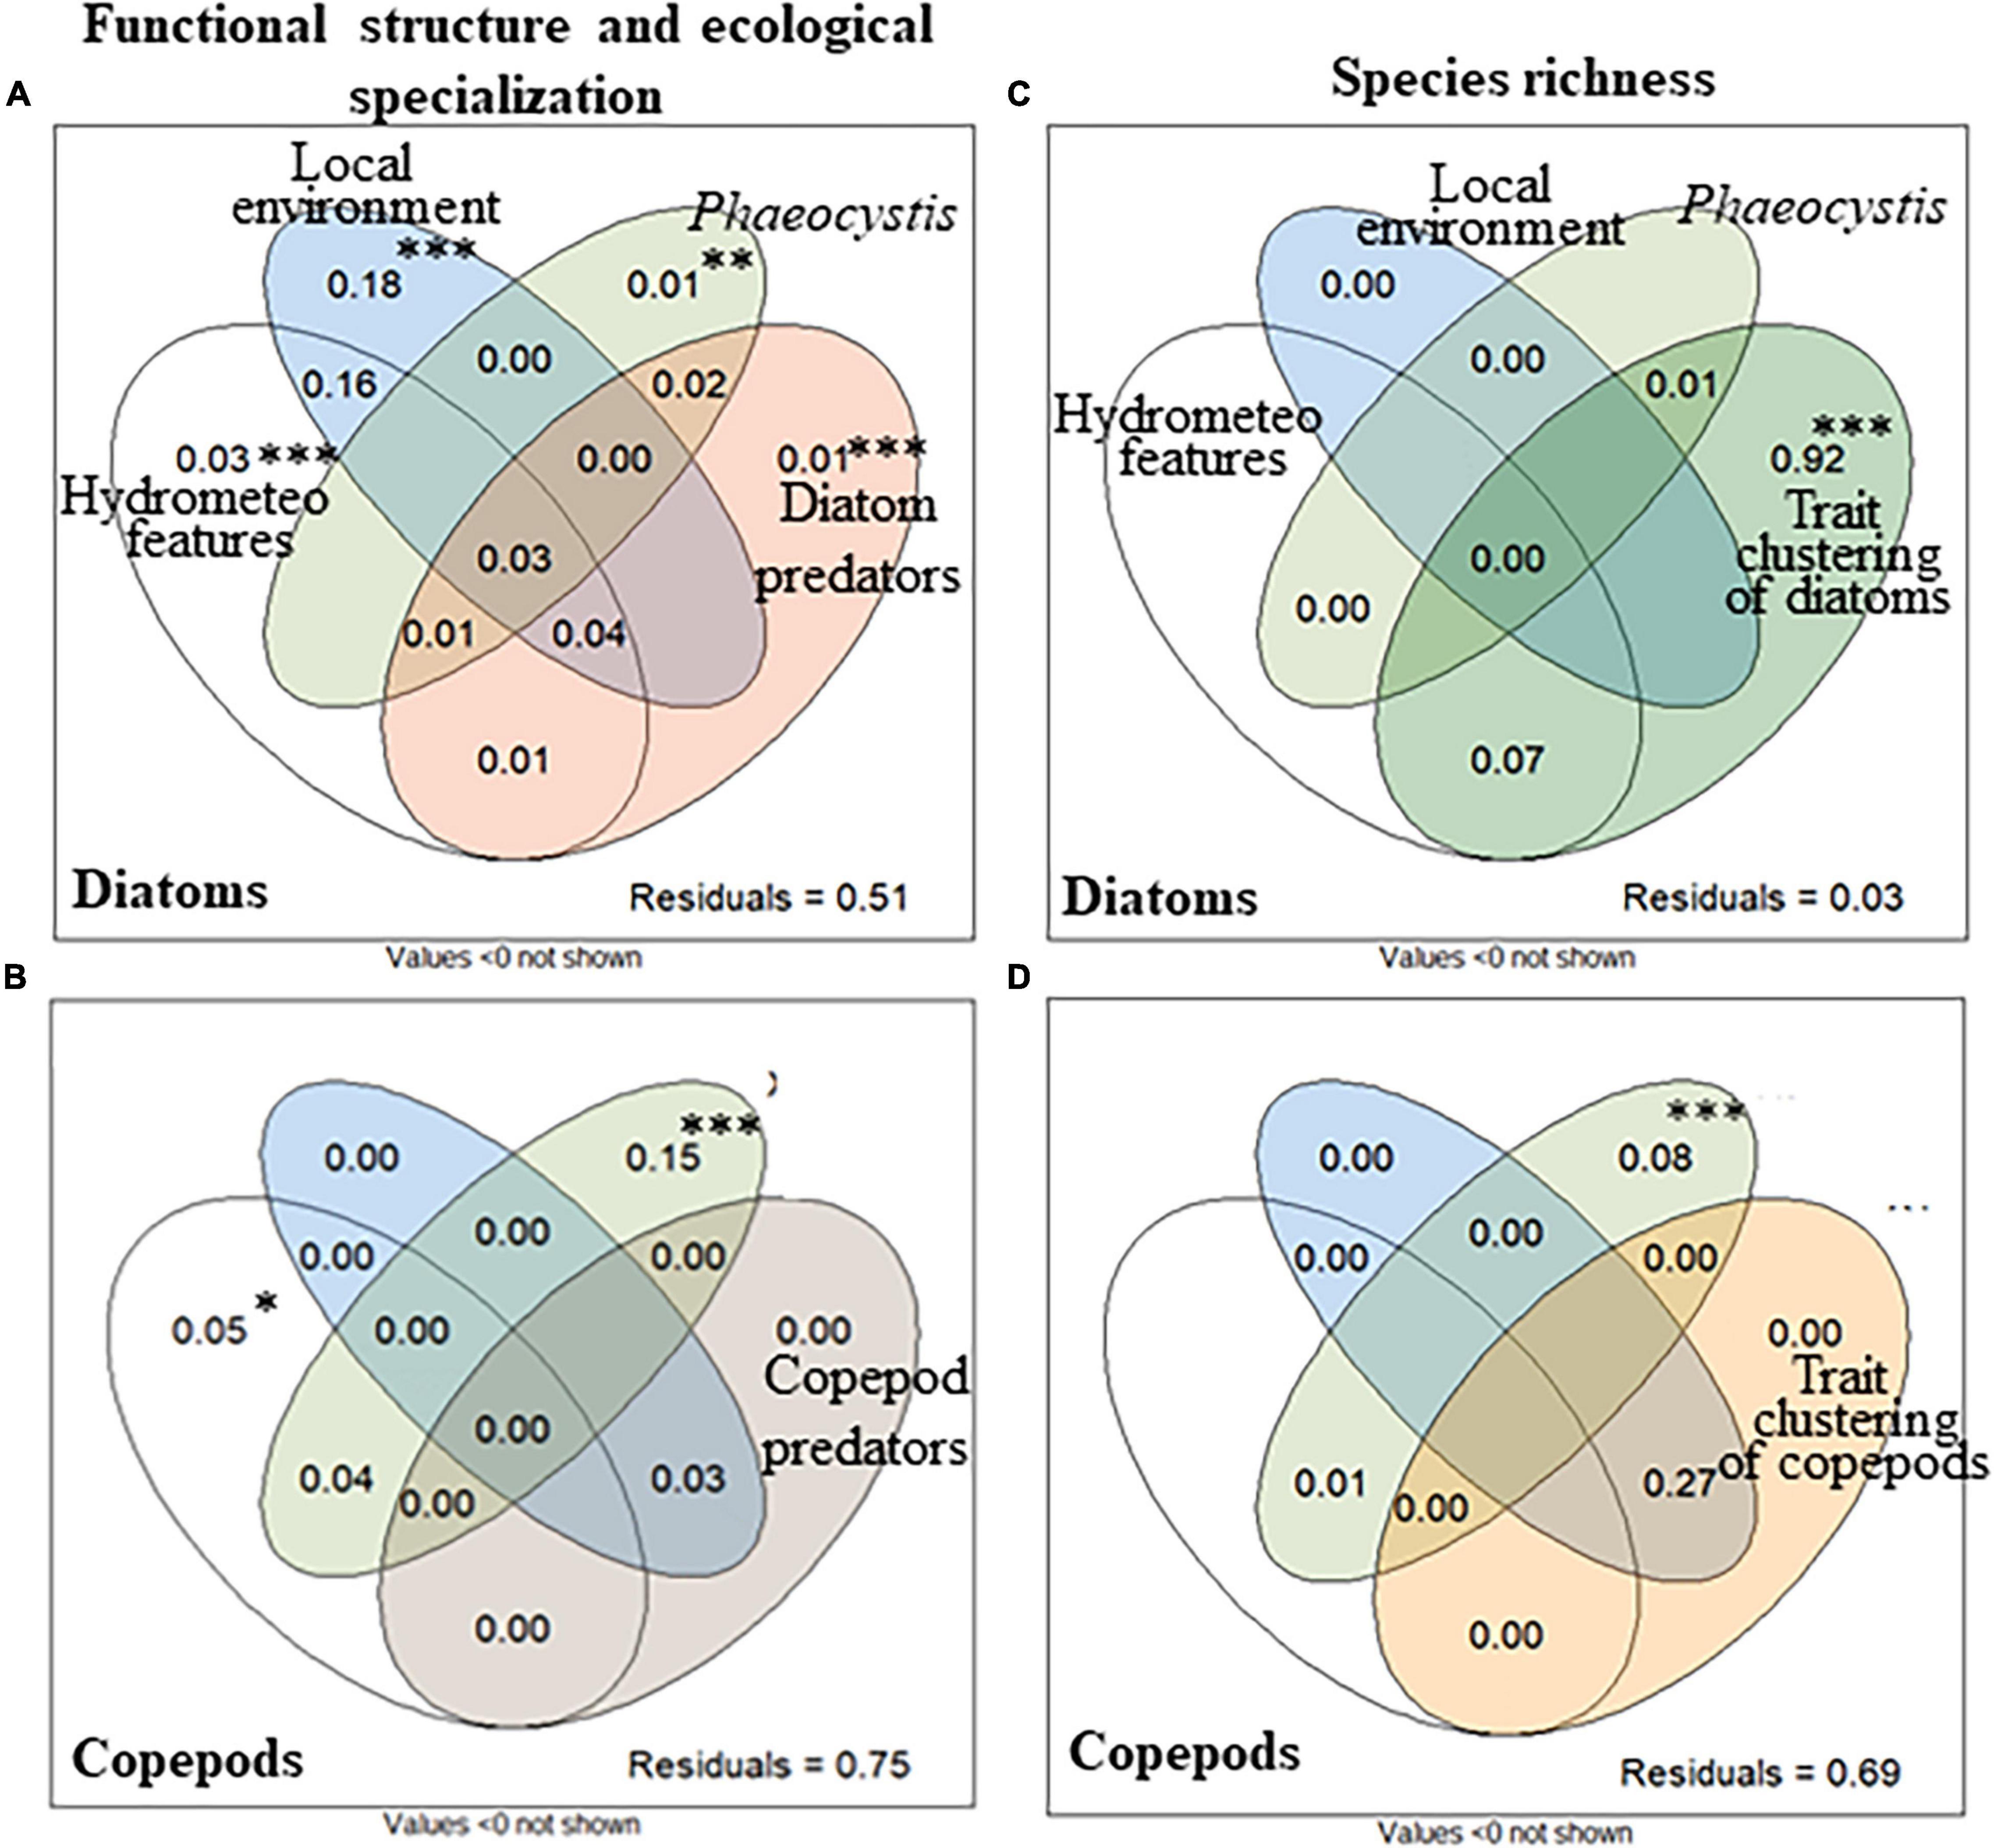
Figure 7. Variation partitioning of the effect of water masses movement and hydrometeorological features (wind stress and direction, white circle), local environment (abiotic and prey biomass, blue circle), Phaeocystis biomass (light green circle), predator patterns (light brown: maximum.size of copepods, and biomass of copepods and protozooplankton for diatoms; dark brown: biomass of fish larvae, chaetognaths and jellyfish for copepods), biotic interaction (trait clustering as a proxy; dark green: diatoms, orange: copepods; using SES-RaoQ), the interactions, and the residual proportion on the (A,B) functional structure and the ecological specialization and (C,D) species richness of the (A,C) diatom and (B,D) copepod communities in coastal waters of the eastern English Channel over the period 2007–2013. Proportions of variations [adjusted r2 calculated from redundancy analysis (rda)] in the response variables explained by the explanatory ones are shown. The statistical significance of proportions is calculated by permutation test for rda (∗∗∗p = 0.001, ∗∗p = 0.005, and ∗p < 0.05). Variance values below are not shown. Note that the shared partitions cannot be tested for statistical significance.
Phaeocystis biomass had no significant effect on the diatom species richness, biomass, FD (i.e., SES-FRic, SES-FEve, and SES-RaoQ), ecological specialization (i.e., niche breadths), or the functional structure (i.e., CWMs) of the diatom community (Supplementary Figure 9).
Discussion
In this study, we investigated the challenging questions of linking the seasonal succession of planktonic organisms with resource and defense traits, and the identification of the conditions that shape species richness. The results showed that the diatom and copepod communities of the EEC respond synchronously to varying abiotic and biotic conditions. We highlighted that some environmental drivers acted on some trait combinations, through environmental filtering, leading to temporal succession in species composition. Such a pattern was possible through the expression of several well-established functional trait trade-offs that allowed us to optimize the fitness of a species in a particular environment. The results strongly suggested that the competition-defense trade-off (e.g., Hillebrand et al., 2000; Chase et al., 2002), a mechanism that favors weak competitors, better protected against predation, played a key role, not only in driving diatom and copepod species richness but also in triggering the Phaeocystis bloom (as shown below). We also revealed the key role of nutrient levels and competition for nutrients, and of prey-predator interactions in the seasonal succession of diatoms and copepods in the coastal waters of the EEC.
The seasonal succession of trait values within the diatom community along with the seasonal gradient of resource, turbulence, and grazing intensity, resulted from several trait trade-off effects: (i) a trade-off in the competitive ability for light vs. nutrients (i.e., S/V cell ratio, coloniality, and specialization for nutrients in opposition to silicification and specialization for light; as shown in Figure 4A; Huisman and Weissing, 1994; Leibold, 1997; Klausmeier and Litchman, 2001); (ii) a defense-competition trade-off (e.g., Hillebrand et al., 2000; Chase et al., 2002); and (iii) an opportunistic-gleaner strategy trade-off (Grover, 1990). We revealed a clear opposition in the dominance between r- and K-strategists: species with high maximum growth rate and photosynthetic efficiency adapted to low light but high nutrient and turbulent conditions on the one hand (e.g., diatoms: Armbrust, 2009, and Phaeocystis colony: Rousseau et al., 2007; Seuront et al., 2007; Nissen and Vogt, 2021), and species which have low maximum growth rate but high competitiveness for nutrients, such as Synechococcus and picoeukaryotes (Stawiarski, 2014), on the other hand. The defense-competition trade-off was deduced from the fact that the diatom communities with the highest proportion of level against predation species matched with periods of (i) high grazing intensity [i.e., late winter/spring (February–March) and late summer/autumn (September–October)] (Gasparini et al., 2000; Stelfox-Widdicombe et al., 2000; Antajan, 2004; Grattepanche et al., 2011b); and (ii) low competitiveness for nutrients (i.e., high silicification but low specialization for nutrients and low S/V cell ratio). The association between the defensive trait and cell biovolume was consistent with this functional trait trade-off (Figure 4A). To invest in defensive traits against predation, is generally metabolically costly, in such a way that prey with high defense levels has generally lower maximum growth rate, maximum resource uptake, and/or resource uptake affinity (Pančić and Kiørboe, 2018; Cadier et al., 2019; Ehrlich et al., 2020), all these types of defense costs being related to cell biovolume (Litchman and Klausmeier, 2008; Marañón, 2015).
We observed seasonal successions of copepod species of varying maximum size values, feeding strategies, trophic regimes, and vulnerability to predation along a seasonal gradient of turbulence, food level and composition, and predator abundance (Figures 2A,B, 3A–D, 4B, 6C), in line with a competition-defense trade-off. Actively feeding copepods feed more efficiently on non-motile than on motile preys (i.e., competitive specialists), but they are more at predation risk than ambush feeders (i.e., defense specialists) (Almeda et al., 2018). This suggests that the shift toward the dominance of ambush copepod feeders (i.e., predators) during summer might result from strong predation pressure on active-feeding copepods by zooplanktivorous organisms, especially jellyfish (i.e., Cnidaria and Ctenaria). The increasing abundance of jellyfish during summer (Figure 6C) is known to exert strong top-down control on copepods (Hirst and Kiørboe, 2002). Ambush copepod feeders, mainly carnivores (Figure 4B), were also smaller, and with a lower metabolic cost (Kiørboe, 2011 and references therein) than actively feeding copepods. The presumed strong predation pressure of jellyfish on active-feeding copepods, in combination with the shift toward dominance of motile prey, might also explain the shift in maximum size and diet change that we observed for the copepod community from July (Supplementary Figures 6A,C–F). The dominance of active feeding-current feeders observed during the first quarter is consistent with the dominance of non-motile prey of high food level (i.e., the spring bloom), their higher metabolic needs (Kiørboe, 2011 and references therein), and a lower abundance of zooplanktivore predators (Figure 6C). The prevalence of omnivory in winter and spring, which results from higher detritivory, is consistent with the high quantity of detrital material in winter, and both Phaeocystis aggregates and ghost colonies in spring (Becquevort et al., 1998; Mari et al., 2005). The significant decline in the grazing rate of copepods, often reported during a Phaeocystis bloom (Gasparini et al., 2000; Nejstgaard et al., 2007 and references therein), might result from a shift in the diet of copepods toward Phaeocystis detrital material.
We hypothesize that the increase in diatom species richness in early spring and autumn resulted from high grazing pressure by generalist copepods, which grazed the dominant highly competitive diatoms that displayed weak defensive traits. Annual maxima of diatom species richness (Figure 5A and Supplementary Figure 7A) matched with periods of annual maxima of defense level (Figure 6B and Supplementary Figures 4O,P) and high grazing pressure occurred at this time of the year (Gasparini et al., 2000; Antajan, 2004). Seasonal variations in diatom species richness were inversely related to functional divergence linked to resource and defense (SES-RaoQ and SES-RaoQdef) (Figures 5A,E,F and Supplementary Figures 7A,D,E). This indicates that species richness increased as the diatom community converged toward species of similar traits for resource and defense. Trait convergence, which results from abiotic stress (Cornwell and Ackerly, 2009) and/or competitive dominance and ensuing species exclusion (Mayfield and Levine, 2010), is unlikely given the increase in diatom biomass and species richness in early spring and autumn. Cavender-Bares et al. (2009) demonstrated that generalist consumers are expected to cluster prey communities toward species with high defense levels. Although we observed a pattern in line with Cavender-Bares et al. (2009) during the spring period, the autumnal peak in diatom species richness that we observed in the data was associated with specialist ambush and carnivore feeders: such a discrepancy may result from the high predation pressure exerted by jellyfish on generalist and actively feeding copepods (Figure 6C), which are more vulnerable to predation in comparison to passive ambush feeders (Kiørboe, 2011 and references therein). Copepod species richness also peaked in autumn, when the copepod community converged toward species of the similar maximum size, trophic preference, and feeding mode (Figure 6C) and when we observed dominance of copepod species less vulnerable to predation (i.e., passive ambush feeders; Kiørboe, 2011 and references therein, Almeda et al., 2018; refer also “feeding mode” in Figure 6C and Supplementary Table 6). However, the seasonal succession of copepod species was by far less evident than for diatoms. The lack of identification of the different copepodite stages, with sizes varying by one order of magnitude between the different copepodite stages (i.e., CI–CVI, Durbin and Durbin, 1978; Cohen and Lough, 1981), probably explained the result. Moreover, copepods live much longer than diatom cells (several months/up to 1 year for copepods, but a few days for diatoms) and their traits enable them to survive in unfavorable conditions. Large unexplained variance (>50%), as we quantified in the VP analysis, is common in ecological studies (Brasil et al., 2020 and references therein) and is often the result of (i) unmeasured environmental drivers, such as trace metals (Chappell et al., 2019); and (ii) potential antagonistic responses among species within a community (Brasil et al., 2020). Brasil et al. (2020) have also recently provided evidence that the assessment of biodiversity and FD is influenced by the presence/lack of rare species: rarity can contribute to large residuals when varpart models are computed. The uncertainty in plankton counts [estimated to be 10% for diatoms based on the table of Lund et al. (1958), and 3–40% for zooplankton (Mack et al., 2012; Kwong and Pakhomov, 2021) with an average of 30% (Frontier, 1969)] could have contributed to the large unexplained discrepancies found in the VP analyses (Brasil et al., 2020). Uncertainty in the species carbon conversion factors that we used for the calculation may have also influenced the estimations and the initial assumptions on how to capture the biological responses, such as linearity of the relationships between the response and explanatory matrices or statistical normality.
Despite potential shortcomings inherent to both the nature of the data and methodological assumptions, we characterized the important role of prey-predator interaction in shaping autumnal copepod community as a consequence of a strong predation pressure by jellyfish on the actively feeding copepods, which in turn induces relaxation of prey-prey competitive interactions. Because of the dominance of phytoplankton r- strategists in spring and autumn, generalist consumers might have grazed mainly on the dominant diatom species that displayed higher growth rates than diatom species with strongly defended cells. Several studies have suggested that species coexistence is possible only under both high grazing pressure and nutrient level conditions to allow the strongly grazed species to regrow after grazing (e.g., Proulx and Mazumder, 1998; Leibold, 1999; Worm et al., 2002). This could explain why diatom species richness declined in summer when nutrients are growth-limiting and the grazing pressure much lower than in spring and autumn (Gasparini et al., 2000; Stelfox-Widdicombe et al., 2000; Antajan, 2004; Grattepanche et al., 2011b). The defense-competition trade-offs could have reduced the frequency of well-defended, but poor-competitive, species and reduced diatom species richness in nutrient-limiting conditions that favor competitive exclusion. The relatively high S/V cell ratio and chain length values, but lowest silicification and defense level, observed in summer, reinforce this idea of the prevalence of competitive exclusion during this period. The concomitant shift toward niche differentiation through the tendency toward a decrease in functional divergence (e.g., Cornwell and Ackerly, 2009), according to the principle of limiting similarity (Macarthur and Levins, 1967), also suggested competitive exclusion. Such shift toward niche differentiation, paralleled by a decrease in species richness, started in April from the maximum of the Phaeocystis bloom. It suggests that the unbalancing of the defense-competition trade-off toward competitive exclusion began at the time Phaeocystis is a poor competitor for nitrate (Lancelot et al., 1998), has, in average, a lower maximum growth rate than diatoms (e.g., Breton et al., 2017 and reference therein), but strong protection against grazing by forming colonies that grow larger in the presence of predators (Jakobsen and Tang, 2002; Long et al., 2007; Nejstgaard et al., 2007, and references therein). Phaeocystis might have consequently benefited from the grazing preference of generalists toward poor-defended, but highly competitive, species (Figure 8). The seasonal maximum of the defense trait value (Figure 8A), the start of the transformation of Phaeocystis flagellate cells into colonial cells embedded into a mucopolysaccharide matrix (Figure 8B, orange arrow), as well as the timing of bloom initiation of Phaeocystis (Figure 8C, blue arrow), were synchronized. The results highlight the potential key role in the defense-competition trade-off besides nutrient level in triggering the Phaeocystis bloom, and more generally, the cardinal role of generalist consumers in the initiation of the bloom. As observed for other ecological communities [Chihoub et al., 2020 (copepods); Wengrat et al., 2018 (diatoms); Villéger et al., 2014; Menezes et al., 2015; Alexander et al., 2017 (fish); Rogalski et al., 2017 (daphniids); Donohue et al., 2009; Zhang et al., 2019 (benthic invertebrates)], eutrophication favors biotic homogenization, which in turn may favor blooms of inedible species such as Phaeocystis. We did not detect any negative effect of the Phaeocystis bloom on the plankton community (Supplementary Figure 9), but a shift of the copepod community toward biotic homogenization was detected.
FIGURE 8
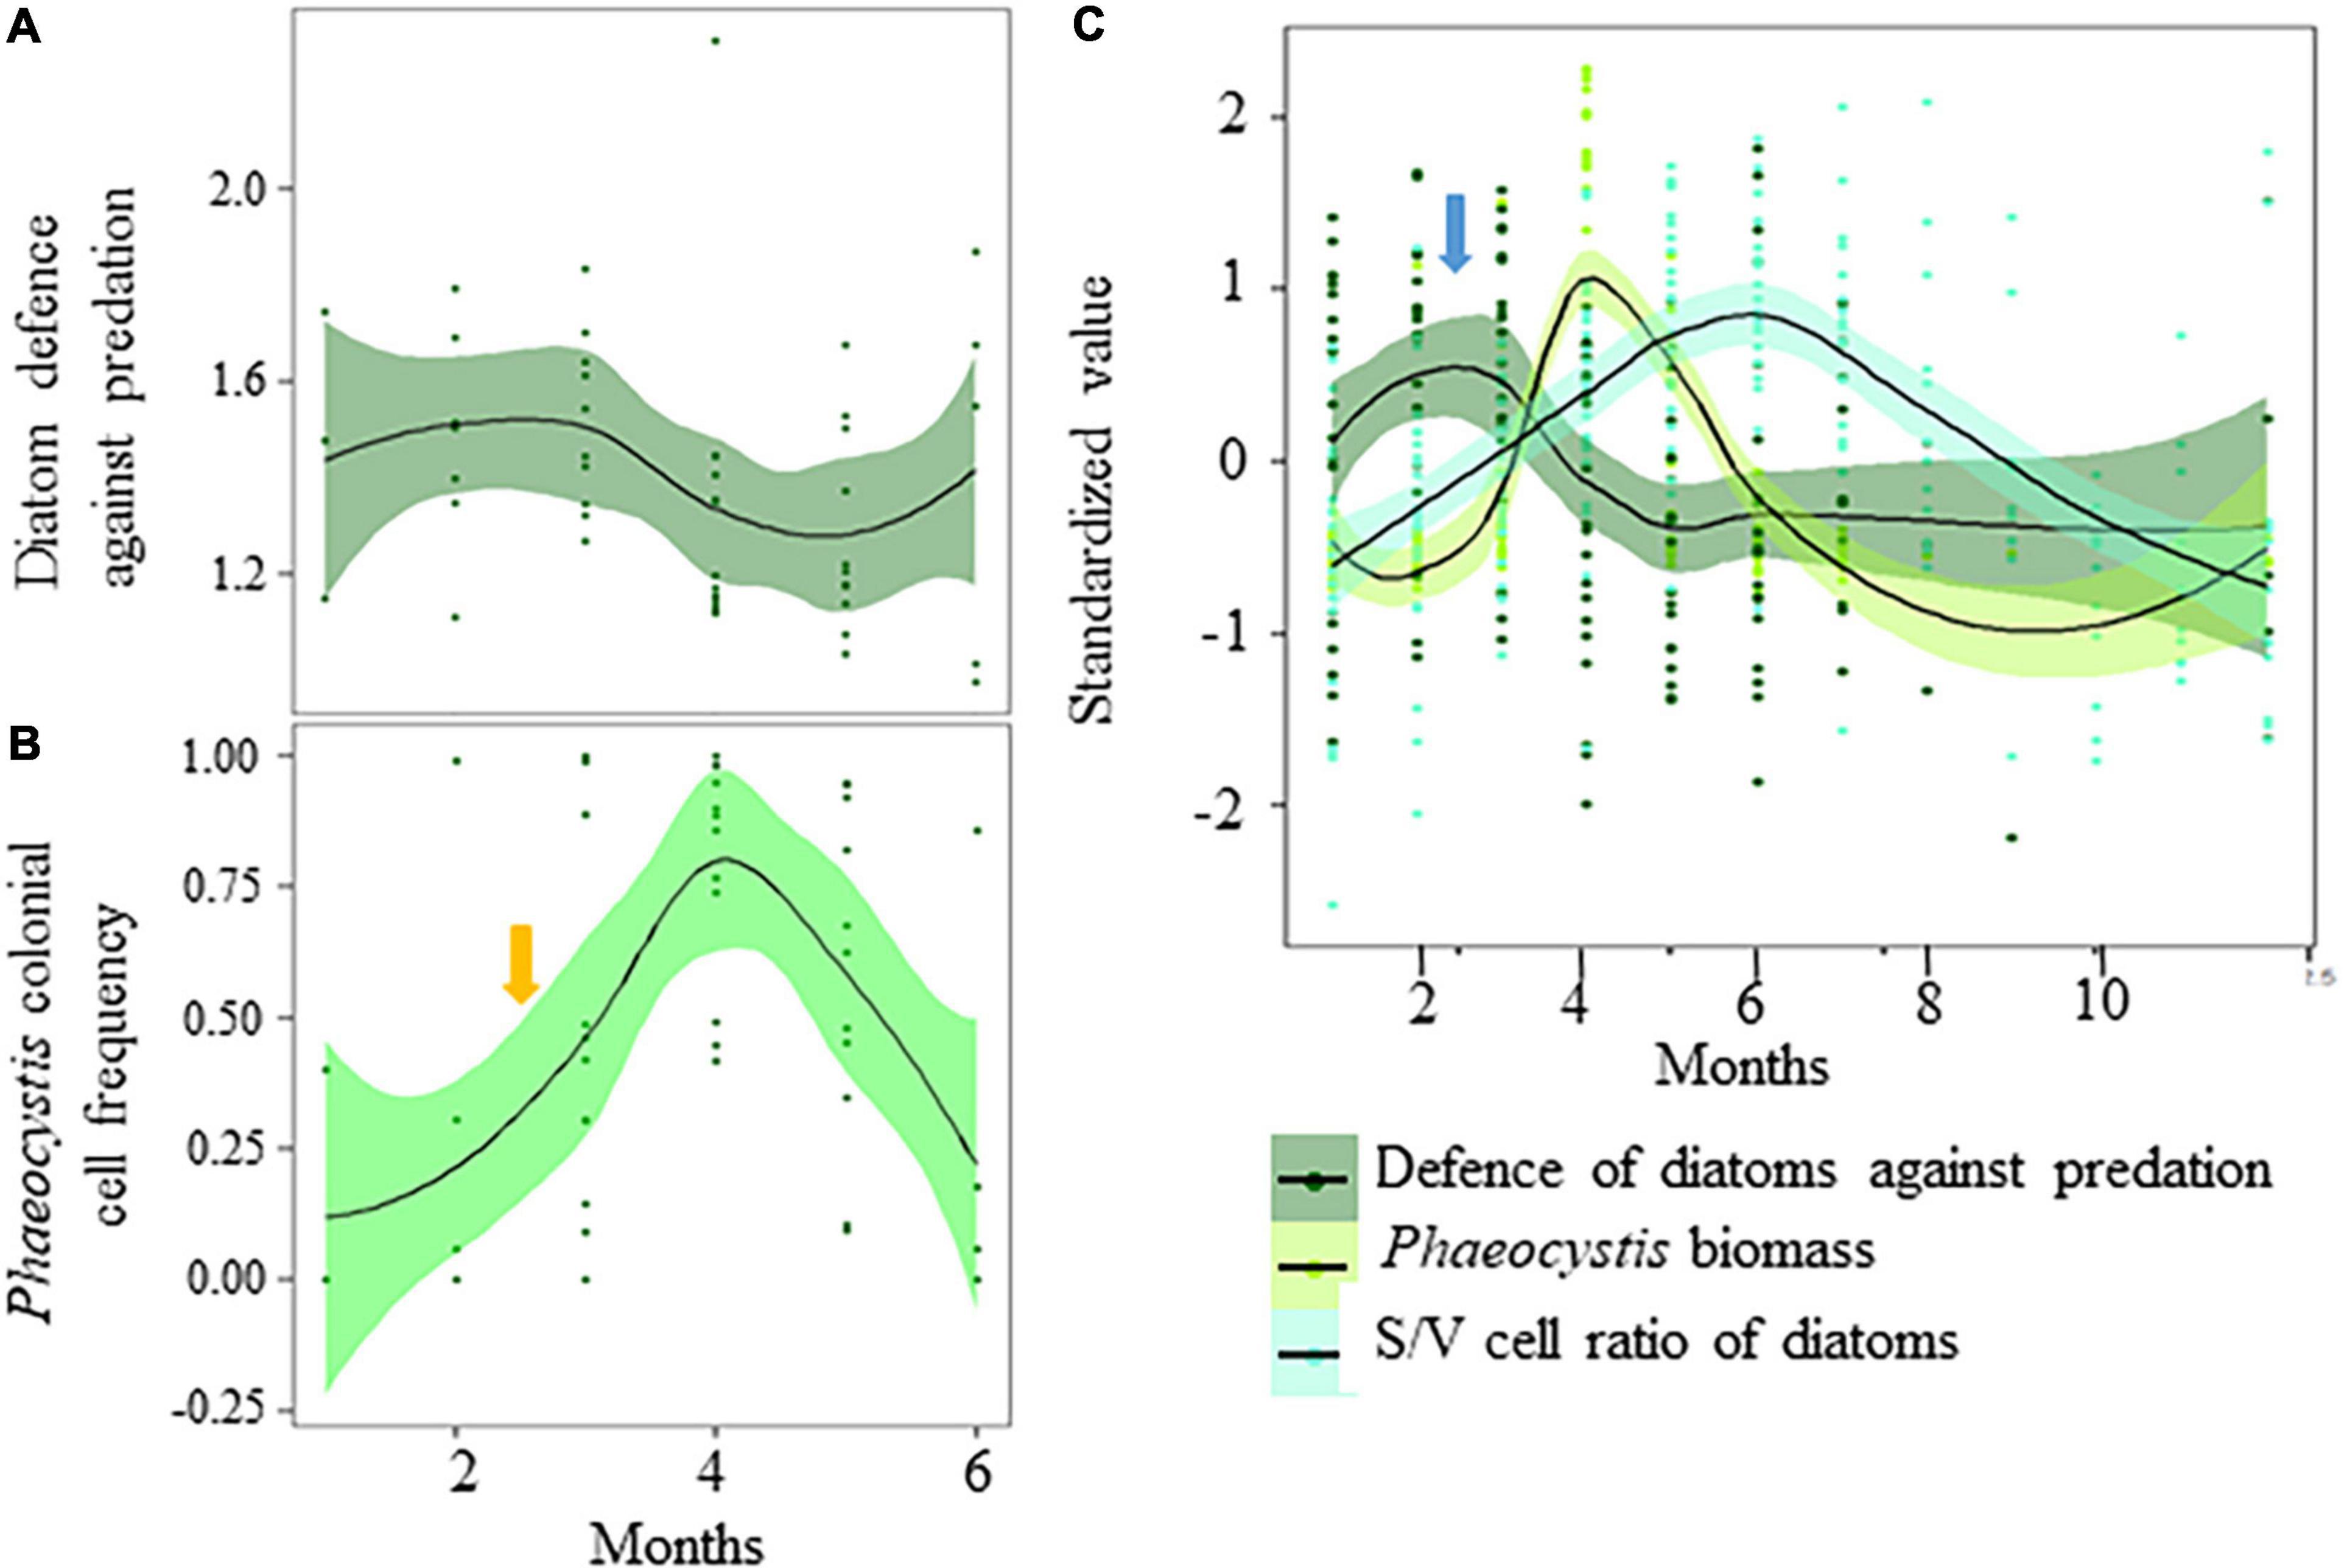
Figure 8. Winter-spring variations in panel (A) the Community-Weight mean of Defence against predation of the diatom community (standardized value; black line and dark green shading), and (B,C) Phaeocystis colonial cell frequency and biomass (standardized value; black line and green shading) in coastal waters of the eastern English Channel over the (A,B) 2007–2019 and (C) 1996–2019. The solid line and ribbon represent LOESS smoothing and the 95% confidence interval, respectively. Standardized values were calculated per year. Note that (A) the seasonal maximum of the defense trait value, (B) the start of the transformation of Phaeocystis flagellate cells into colonial cells embedded into a mucopolysaccharide matrix (orange arrow) and (C) the start Phaeocystis bloom timing (blue arrow) are synchronised. Note that the S/V cell ratio of diatoms as proxy of competitiveness is low at this time (C).
Conclusion
The application of a trait-based approach, combined with the assessment of ecological specialization, has made possible a better understanding of seasonal succession and biodiversity patterns in plankton along gradients of resources, turbulence, and grazing pressure. We have shown that species succession is driven by different trade-offs among functional traits, under the functional constraints dictated by the environmental pressure encountered by plankton communities across the seasons. We suggest that the competition-defense trade-off plays an important role in promoting plankton species richness and in triggering the Phaeocystis bloom in coastal waters of the EEC. By successively favoring species with ecological strategies that match environmental conditions, the diatom and copepod communities in coastal waters of the EEC respond synchronously to varying resources and biotic conditions.
Data Availability Statement
The raw data supporting the conclusions of this article are available by the authors in Supplementary Data.
Author Contributions
EB, BS, and EG conceptualized the study. EB and EG performed the investigation on methodology. EB, BS, D-IS, DP, CS, MC, SF, J-MB, and AL provided the abiotic and biological data. EB, AP, OD, and EG performed the data analysis. EB, UC, EG, BS, LK, GB, and LS contributed to the manuscript writing. All authors contributed to the article and approved the submitted version.
Funding
This work was a contribution of the project EVOLECO-NUPHY supported by the French National program LEFE (Les Enveloppes Fluides et l’Environnement).
Conflict of Interest
The authors declare that the research was conducted in the absence of any commercial or financial relationships that could be construed as a potential conflict of interest.
Publisher’s Note
All claims expressed in this article are solely those of the authors and do not necessarily represent those of their affiliated organizations, or those of the publisher, the editors and the reviewers. Any product that may be evaluated in this article, or claim that may be made by its manufacturer, is not guaranteed or endorsed by the publisher.
Acknowledgments
We acknowledge the three reviewers for their constructive comments, which allowed us to greatly improve the manuscript. We thank the crews who helped during long-term monitoring downstream of the Gironde estuary (2001–2017) and in coastal waters of the eastern English Channel (1996–2019), and the SOMLIT teams for sampling and physicochemical measurements and analysis, especially N. Degros, E. Lecuyer, and H. Derriennic. We also thank the students T. Rault and G. Parmentier for copepod identification and counts and S. Bosc and P. Faye for their contribution to diatom cell measurements. This work is dedicated to J.-M. Dewarumez, who managed SOMLIT at Wimereux, and P. Lebleu, who performed sampling in the Gironde estuary.
Supplementary Material
The Supplementary Material for this article can be found online at: https://www.frontiersin.org/articles/10.3389/fmars.2021.656300/full#supplementary-material
Footnotes
- ^ www.somlit.fr
- ^ http://www.soda-pro.com/web-services/radiation/cams-radiation-service
- ^ https://psl.noaa.gov/data/gridded/data.ncep.html
References
Alexander, T. J., Vonlanthen, P., and Seehausen, O. (2017). Does eutrophication-driven evolution change aquatic ecosystems? Philos. Trans. R. Soc. B Biol. Sci. 19:372. doi: 10.1098/rstb.2016.0041
Almeda, R., van Someren Gréve, H., and Kiørboe, T. (2018). Prey perception mechanism determines maximum clearance rates of planktonic copepods. Limnol. Oceanogr. 63, 2695–2707. doi: 10.1002/lno.10969
Aminot, A., and Kérouel, R. (2004). Hydrologie des Écosystèmes Marins: Paramètres et Analyses. Brest: Ifreme.
Antajan, E. (2004). Responses of Calanoid Copepods to Changes in Phytoplankton Dominance in the Diatoms - Phaeocystis Globosa Dominated Belgium Coastal Waters. Ph.D. thesis. Brussel: Vrije Universiteit Brussel, 142.
Armbrust, E. V. (2009). The life of diatoms in the world’s oceans. Nature 459, 185–192. doi: 10.1038/nature08057
Beaugrand, G., Brander, K. M., Lindley, J. A., Souissi, S., and Reid, P. C. (2003). Plankton effect on cod recruitment in the North Sea. Nature 426, 661–664. doi: 10.1038/nature02164
Becquevort, S., Rousseau, V., and Lancelot, C. (1998). Major and comparable roles for free-living and attached bacteria in the degradation of Phaeocystis-derived organic matter in coastal waters of the North Sea. Aquat. Microb. Ecol. 14, 39–48. doi: 10.3354/ame014039
Benedetti, F., Gasparini, S., and Ayata, S. D. (2016). Identifying copepod functional groups from species functional traits. J. Plankton Res. 38, 159–166. doi: 10.1093/plankt/fbv096
Bjærke, O., Jonsson, P. R., Alam, A., and Selander, E. (2015), Is chain length in phytoplankton regulated to evade predation? J. Plankton Res. 37, 1110–1119. doi: 10.1093/plankt/fbv076
Biggs, C. R., Yeager, L. A., Bolser, D. G., Bonsell, C., Dichiera, A. M., Hou, Z., et al. (2020). Does functional redundancy affect ecological stability and resilience? A review and meta-analysis. Ecosphere 11: e03184. doi: 10.1002/ecs2.3184
Blonder, B., Lamanna, C., and Violle, C. and Enquist, B. J. (2014). The n-dimensional hypervolume. Global Ecol. Biogeogr. 23, 595–609. doi: 10.1111/geb.12146
Bonato, S., Breton, E., Didry, M., and Lizon, F. (2016). Spatio-temporal patterns in phytoplankton assemblages in coastal-offshore gradients using flow cytometry: a case study in the eastern English Channel. J. Mar. Syst. 156, 76–85. doi: 10.1016/j.jmarsys.2015.11.009
Borcard, D. P., Legendre, P., Drapeau, P. (1992). Partialling out the spatial component of ecological variation. Ecology 73, 1045–1055. doi: 10.2307/1940179
Botta-Dukát, Z. (2005), Rao’s quadratic entropy as a measure of functional diversity based on multiple traits. J. Veg. Sci. 16, 533–540. doi: 10.1111/j.1654-1103.2005.tb02393.x
Botta-Dukát, Z. and Czúcz, B. (2016). Testing the ability of functional diversity indices to detect trait convergence and divergence using individual-based simulation. Methods Ecol. Evol. 7, 114–126.
Brasil, L. S., Vieira, T. B., and Andrade, A. F. A. (2020). The importance of common and the irrelevance of rare species for partition the variation of community matrix: implications for sampling and conservation. Sci. Rep. 10:19777. doi: 10.1038/s41598-020-76833-5
Breton E., Brunet C., Sautour B., and Brylinski, J. M. (2000). Annual variations of phytoplankton biomass in the eastern English Channel: comparison by pigment signatures and microscopic counts. J. Plankton Res. 22, 1423–1440. doi: 10.1093/plankt/22.8.1423
Breton, E., Rousseau, V., Parent, J. Y., Ozer, J., and Lancelot, C. (2006). Hydroclimatic modulation of diatom/Phaeocystis blooms in nutrient-enriched Belgian coastal waters (North Sea). Limnol. Oceanogr. 51, 1401–1409. doi: 10.4319/lo.2006.51.3.1401
Breton, E., Christaki, U., Bonato, S., Didry, M., and Artigas, L. F. (2017). Functional trait variation and nitrogen use efficiency in temperate coastal phytoplankton. Mar. Ecol. Prog. Ser. 563, 35–49. doi: 10.3354/meps11974
Brody, S. R., Lozier, M. S., and Dunne, J. P. (2013). A comparison of methods to determine phytoplankton bloom initiation. J. Geophys. Res. Oceans, 118, 2345–2357. doi: 10.1002/jgrc.20167
Brun, P., Payne, R., and Kiørboe, T. (2017). A trait database for marine copepods. Earth Syst. Sci. Data 9, 99–113. doi: 10.5194/essd-2016-30
Buitenhuis, E. T., Li, W. K. W., Vaulot D., and Lomas M. W. (2012). Picophytoplankton biomass distribution in the global ocean. Earth Syst. Sci. Data 4, 37–46. doi: 10.5194/essd-4-37-2012
Cadier, M., Andersen, K. H., and Visser, A. W. and Kiørboe, T. (2019). Competition–defense tradeoff increases the diversity of microbial plankton communities and dampens trophic cascades. Oikos 128, 1027–1040. doi: 10.1111/oik.06101
Cahoon, L. B. (1999). The role of benthic microalgae in neritic ecosystems. Oceanogr. Mar. Biol. Annu. Rev. 37, 47–86.
Cavender-Bares, J., Kozak, K. H., Fine, P. V. A., and Kembel, S. W. (2009). The merging of community ecology and phylogenetic biology. Ecol. Lett. 12, 693–715. doi: 10.1111/j.1461-0248.2009.01314.x
Chappell, P. D., Armbrust, E. V., Barbeau, K. A., Bundy, R. M., Moffett, J. W., Vedamati, J., and Jenkins, B. D. (2019). Patterns of diatom diversity correlate with dissolved trace metal concentrations and longitudinal position in the northeast Pacific coastal offshore transition zone. Mar. Ecol. Prog. Ser. 563, 35–49.
Chase, J. M., Abrams, P. A., Grover, J. P., Diehl, S., Chesson, P., and Holt, R. D. et al. (2002). The interaction between predation and competition: a review and synthesis. Ecol. Lett. 5, 302–315. doi: 10.1046/j.1461-0248.2002.00315.x
Chessel, D., Dufour, A. B., and Thioulouse, J. (2004). The ade4 package-I-One-table methods. R. News 4, 5–10.
Chihoub, S., Christaki, U., Chelgham, S., Amara, R., Ramdane, Z., Zebboudj, A., Rachik, S., and Breton, E. (2020). Coastal eutrophication as a potential driver of functional homogenization of copepod species assemblages in the Mediterranean Sea. Ecol. Ind. 115:106388. doi: 10.1016/j.ecolind.2020.106388
Clavel, J., Julliard, R., and Devictor, V. (2011). Worldwide decline of specialist species: toward a global functional homogenization? Front. Ecol. Environ. 9, 222–228. doi: 10.1890/080216
Cohen, R. E. and Lough, R. G. (1981). Length-weight relationships for several copepods dominant in the Georges BankGulf of Maine area. J. Northw. Atl. Fish. Sci. 2, 47–52. doi: 10.2960/J.v2.a4
Conway, D. V. P. (2006). Identification of the copepodite developmental stages of twenty-six North Atlantic copepods. J. Mar. Biolog. Assoc. U.K. 21, 1–28.
Cornwell, W. K. and Ackerly, D. D. (2009). Community assembly and shifts in plant trait distributions across an environmental gradient in coastal California. Ecol. Monogr. 79, 109–126. doi: 10.1890/07-1134.1
Dam, H. G. and Peterson, W. T. (1991). In situ feeding behaviour of the copepod Temora longicornis: effects of seasonal changes in chlorophyll size fractions and female size. Mar. Ecol. Prog. Ser. 71, 113–123. doi: 10.3354/meps071113
Djeghri, N., Atkinson, A., Fileman, E. S., Harmer, R. A., Widdicombe, C. E., McEvoy, A. J., Cornwell, L., and Mayor, D. J. (2019). High Prey-predator size ratios and unselective feeding in copepods: a seasonal comparison of five species with contrasting feeding modes, Prog. Oceanogr.177:102039. doi: 10.1016/j.pocean.2018.11.005
Dolédec, S., and Chessel, D. (1994). Co-inertia analysis: an alternative method for studying species–environment relationships. Freshw. Biol. 31, 277–294. doi: 10.1016/0269-7491(87)90079-0
Dolédec, S., and Chessel, D. and Gimaret-Carpentier, C. (2000). Niche separation in community analysis: a new method. Ecology 81, 2914–2927. doi: 10.1890/0012-96582000081
Donohue, I., Jackson, A. L., Pusch, M. T., and Irvine, K. (2009). Nutrient enrichment homogenizes lake benthic assemblages at local and regional scales. Ecology 90, 3470–3477. doi: 10.1890/09-0415.1
Dray, S., Chessel, D., and Thioulouse, J. (2003). Co-inertia analysis and the linking of ecological data tables. Ecology 84, 3078–3089. doi: 10.1890/03-0178
Dray, S., Dufour, A.B., and Chessel, D. (2007). The ade4 Package-II: two-table and K-table methods. R. News 7, 47–52.
Dray, S., Pélissier, R., Couteron, P., Fortin, M., Legendre, P., Peres-Neto, P. R., et al. (2012). Community ecology in the age of multivariate multiscale spatial analysis. Ecol. Monogr. 82, 257–275. doi: 10.1890/11-1183.1
Durbin, E. G. and Durbin, A. G. (1978). Length and weight relationships of Acartia clausi from Narragansett Bay, R.I. Limnol. Oceanogr. 23, 958–969 doi: 10.4319/lo.1978.23.5.0958
Ehrlich, E., Kath, N. J., and Gaedke, U. (2020). The shape of a defense-growth trade-off governs seasonal trait dynamics in natural phytoplankton. ISME J. 14, 1451–1462. doi: 10.1038/s41396-020-0619-1
Frontier, S. (1969). Sur une méthode d’analyse faunistique rapide du zooplancton. exp. mar. Biol. Ecol. 3, 18–26.
Garnier, E., Cortez, J., Billes, G., Navas, M. L., Roumet, C., Debussche, M., Laurent, G., Blanchard, A., Aubry, D., Bellmann, A., Neill, C., and Toussaint, J. P. (2004). Plant functional markers capture ecosystem properties during secondary succession. Ecology 85, 2630–2637. doi: 10.1890/03-0799
Garnier, J., Riou, P., Le Gendre, R., Ramarson, A., Billen, G, Cugier, P., Schapira, M., Théry, S., Thieu, V., and Ménesguen, A. (2019). Managing the agri-food system of watersheds to combat coastal eutrophication: a land-to-sea modelling approach to the french coastal english channel. Geosciences 9:441. doi: 10.3390/geosciences9100441
Gasparini, S., Daro, M. H., Antajan, E., Tackx, M., Rousseau, V., Parent, J. Y., and Lancelot, C. (2000). Mesozooplankton grazing during the Phaeocystis globosa bloom in the Southern Bight of the North Sea. J. Sea Res. 43, 345–356. doi: 10.1016/S1385-1101(00)00016-2
Gini, C. (1912). «Variabilità e Mutabilità», Studi Economico-Giuridici dell’Univ. Di Cagliari 3, 1–158. doi: 10.2307/2340052
Gómez, F. and Souissi, S. (2007). The distribution and life cycle of the dinoflagellate Spatulodinium pseudonoctiluca (Dinophyceae, Noctilucales) in the northeastern English Channel. C. R. Biologies, 330, 231–236. doi: 10.1016/j.crvi.2007.02.002
Gotelli, N. J. and McCabe, D. J. (2002). Species co-occurrence: a meta-analysis of J. M. Diamond’s assembly rules model. Ecology 83, 2091–2096. doi: 10.1890/0012-96582002083
Gower, J. C. (1971). A general coefficient of similarity and some of its properties. Biometrics 27:857. doi: 10.2307/2528823
Grattepanche, J. D., Breton, E., Brylinski, J. M., Lecuyer, E., and Christaki, U. (2011a). Succession of primary producers and micrograzers in a coastal ecosystem dominated by Phaeocystis globosa blooms. J. Plankton Res. 33, 37–50. doi: 10.1093/plankt/fbq097
Grattepanche, J. D., Vincent, D., Breton, E., and Christaki, U. (2011b). Microzooplankton herbivory during the diatom-Phaeocystis spring succession in the eastern English Channel. J. Exp. Mar. Biol. Ecol. 404, 87–97. doi: 10.1016/j.jembe.2011.04.004
Grover, J. P. (1989). Influence of cell shape and size on algal competitive ability. J. Phycology 25, 402–405. doi: 10.1111/j.1529-8817.1989.tb00138.x
Grover, J. (1990). Resource competition in a variable environment: phytoplankton growing according to Monod’s model. Am. Nat. 136, 771–789. doi: 10.1086/285131
Halpern, B. S., Walbridge, S., Selkoe, K. A., Kappel, C. V., and Micheli, F. (2008). A global map of human impact on marine ecosystems. Science 319, 948–952. doi: 10.1126/science.1149345
Halse, G. R., and Syvertsen, E. E. (1996). “Chapter 2 - marine diatoms”. ed C.R. Tomas. Identifying Marine Diatoms and Dinoflagellates (Cambridge, MA: Academic Press), 5–385.
Hill, S. L., Harfoot, M., Purvis, A., Purves, D. W., Collen, B., Newbold, T., and Burgess, N. D. and Mace, G. M. (2016). Reconciling biodiversity indicators to guide understanding and action. Conserv. Lett. 9, 405–412. doi: 10.1111/conl.12291
Hillebrand, H., Worm, B., and Lotze, H. K. (2000). Marine microbenthic community structure regulated by nitrogen loading and grazing pressure. Mar. Ecol. Prog. Ser. 204, 27–38. doi: 10.3354/meps204027
Hillebrand, H., Dürselen, C. D., Kirschtel, D., Pollingher, U., and Zohary, T. (1999). Biovolume calculation for pelagic and benthic microalgae, J. Phycol. 35, 403–424. doi: 10.1046/j.1529-8817.1999.3520403.x
Hirst, A. G., and Kiørboe, T. (2002). Mortality of marine planktonic copepods: global rates and patterns. Mar. Ecol. Prog. Ser. 230, 195–209. doi: 10.3354/meps230195
Holmes, R. M., Aminot, A., Kérouel, R., Hooker, B. A., and Peterson, B. J. (1999). A simple and precise method for measuring ammonium in marine and freshwater ecosystems. Can. J. Fish Aquat. Sci. 56, 1801–1808. doi: 10.1139/f99-128
Hoppenrath, M., Elbrächter, M., and Drebes, G. (2009). Marine Phytoplankton. Selected Microphytoplankton From the North Sea Around Helgoland and Sylt, E. Stuttgart: Schweizerbartsche Verlagsbuchhandlung, 264.
Howarth, R. W. (2008). Coastal nitrogen pollution: a review of sources and trends globally and regionally. Harmful Algae 8, 14–20. doi: 10.1016/j.hal.2008.08.015
Huisman, J. and Weissing, F. J. (1994). Light-limited growth and competition for light in well-mixed aquatic environments: an elementary model. Ecology 75, 507–520. doi: 10.2307/1939554
Jacoby, W. G. (2000). LOESS: a nonparametric, graphical tool for depicting relationships between variables. Electoral Stud. 19, 577–613. doi: 10.1016/S0261-3794(99)00028-1
Jakobsen, H. H., and Tang, K. W. (2002). Effects of protozoan grazing on colony formation in Phaeocystis globosa (Prymnesiophyceae) and the potential costs and benefits. Aquat. Microb. Ecol., 27, 261–273. doi : 10.3354/ame027261
Jakobsen, H. H., and Markager, S. (2016). Carbon-to-chlorophyll ratio for phytoplankton in temperate coastal waters: seasonal patterns and relationship to nutrients. Limnol. Oceanogr. 61, 1853–1868. doi: 10.1002/lno.10338
Karp-Boss, L., Boss, E., and Jumars, P. A. (1996). Nutrient fluxes to planktonic osmotrophs in the presence of fluid motion. Oceanogr. Mar. Biol. 34, 71–107.
Key, T., McCarthy, A., Campbell, D. A., Six, C., and Roy S. (2010). Cell size trade-offs govern light exploitation strategies in marine phytoplankton. Environ. Microbiol. 12, 95–104. doi: 10.1111/j.1462-2920.2009.02046.x
Kiørboe, T. (2011). How zooplankton feed: mechanisms, traits and trade-offs. Biol. Rev. 86, 311–339. doi: 10.1111/j.1469-185X.2010.00148.x
Kiørboe, T. and Hirst, A. G. (2014). Shifts in mass scaling of respiration, feeding, and growth rates across life-form transitions in marine pelagic organisms. Am. Nat. 183, 118–130. doi :10.1086/675241
Klausmeier, C. A. and Litchman, E. (2001). Algal games: the vertical distribution of phytoplankton in poorly mixed water columns. Limnol. Oceanogr. 46, 1998–2007. doi: 10.4319/lo.2001.46.8.1998
Kneitel, J. M. and Chase, J. M. (2004). Trade-offs in community ecology: linking spatial scales and species coexistence. Ecol. Lett. 7, 69–80. doi: 10.1046/j.1461-0248.2003.00551.x
Kofoid, C. A. and Campbell, A. S. (1929). A conspectus of the marine and freshwater Ciliata belonging to the suborder Tintinnoinea with descriptions of new species, principally from the Agassiz Expedition to the eastern tropical Pacific, 1904–05. Univ. Calif. Publ. Zool. 34:403.
Kuhn, M., Wing, J., Weston, S., Williams, A., Keefer, C., Engelhardt, A., et al. (2016). caret: Classification and Regression Training. R package version 6.0-71. Available online at: https://CRAN.R-project.org/package=caret
Kwong, L. E., and Pakhomov, A. E. (2021). Zooplankton size spectra and production assessed by two different nets in the subarctic Northeast Pacific, J. Plankton Res. 43, 527–545. doi: 10.1093/plankt/fbab039
Laliberté, E. and Legendre, P. (2010). A distance-based framework for measuring functional diversity from multiple traits. Ecology 91, 299–305. doi: 10.1890/08-2244.1
Lancelot, C. (1995). The mucilage phenomenon in the continental coastal waters of the North Sea. Sci. Tot. Environ. Mar. Mucilages 165, 83–102. doi: 10.1016/0048-9697(95)04545-
Lancelot, C., Billen, G., Sournia, A., Weisse, T., Colijn, F., Veldhuis, M. J. W., et al. (1987). Phaeocystis blooms and nutrient enrichment in the continental coastal zones of the North Sea. Ambio 16, 38–46. doi: 10.1016/0198-0254(87)90379-7
Lancelot, C., Keller, M. D., Rousseau, V., Smith, W. O. Jr., and Mathot S. (1998). “Autoecology of the marine haptophyte Phaeocystis sp,” in Physiological Ecology of Harmful Algal Blooms NATO ASI Series, eds D. M. Anderson, A. D. Cembella, G. M. Hallegraeff (Berlin: Springer Verlag), 209–224
Legendre, P. and Legendre, L. (2012). Numerical Ecology: Developments in Environmental Modelling, Vol. 24. Amsterdam: Elsevier Science and Technology.
Leibold, M.A. (1997). Do nutrient-competition models predict nutrient availabilities in limnetic ecosystems? Oecologia 110, 132–142. doi: 10.1007/s004420050141
Leibold, M. A. (1999). Biodiversity and nutrient enrichment in pond plankton communities. Evol. Ecol. Res. 1, 73–95.
Leynaert, A, Bucciarelli, E., Claquin, P., Dugdale, R. C., Martin-Jézéquel, V., Pondaven, P., and Ragueneau, O. (2004). Effect of iron deficiency on diatom cell size and silicic acid uptake kinetics. Limnol. Oceanogr. 49, 1134–1143. doi: 10.4319/lo.2004.49.4.1134
Lingoes, J. C. (1971). Some boundary conditions for a monotone analysis of symmetric matrices. Psychometrika 36, 195–203. doi: 10.1007/BF02291398
Litchman, E, Klausmeier, C. A., Schofield, O. M., Falkowski, P. G. (2007). The role of functional traits and trade-offs in structuring phytoplankton communities: scaling from cellular to ecosystem level. Ecol. Lett. 10, 1170–1181. doi: 10.1111/j.1461-0248.2007.01117.x
Litchman, E., and Klausmeier, C. A. (2008). Trait-based community ecology of phytoplankton. Annu. Rev. Ecol. Evol. Syst. 39, 615-639. doi: 10.1146/annurev.ecolsys.39.110707.173549
Litchman, E., Ohman, M. D., and Kiørboe, T. (2013). Trait-based approaches to zooplankton communities. J. Plankton Res. 35, 473–484.
Long, J. D., Smalley, G. W., and Barsby, T., Anderson, J. T., and Hay, M. E. (2007). Chemical cues induce consumer-specific defenses in a bloom forming marine phytoplankton. Proc. Natl. Acad. Sci. U.S.A. 104, 10512–10517.
Lorenzen, C. J. (1967). Determination of chlorophyll and pheopigments: spectrophotometric equations. Limnol. Oceanogr. 12, 343–346. doi: 10.4319/lo.1967.12.2.0343
Lovecchio, S., Climent, E., Stocker, R., and Durham, W. M. (2019). Chain formation can enhance the vertical migration of phytoplankton through turbulence. Sci. Adv. 5:eaaw7879. doi: 10.1126/sciadv.aaw7879
Lund, J. W. G., Kipling, C., and Le Cren, E. D. (1958). The inverted microscope method of estimating algal numbers and the statistical basis of estimations by counting. Hydrobiologia 11, 143–170. doi: 10.1007/BF00007865
Maar, M., Nielsen, T. G., and Richardson, K. (2002). Spatial and temporal variability of food web structure during the spring bloom in the Skagerrak. Mar. Ecol. Prog. Ser. 239, 11–29.
Mack, H. R., Conroy, J. D., Blocksom, K. A., Stein, R. A., and Ludsin, S. A. (2012). A comparative analysis of zooplankton field collection and sample enumeration methods. Limnol. Oceanogr. Methods 10:41. doi: 10.4319/lom.2012.10.41
Marañón, E. (2015). Cell size as a key determinant of phytoplankton metabolism and community structure. Annu. Rev. Mar. Sci. 7, 241–264. doi: 10.1146/annurev-marine-010814-015955
Mari, X., Rassoulzadegan, F., Brussaard, C., and Wassmann, P. (2005). Dynamics of transparent exopolymeric particles (TEP) production by Phaeocystis globosa under N- or P limitation: a controlling factor of the retention/export balance? Harmful Algae 4, 895–914. doi: 10.1016/j.hal.2004.12.014
Marie, D., Brussaard, C. P. D., Partensky, F., and Vaulot, D. (1999). “Flow cytometric analysis of phytoplankton, bacteria and viruses,” in Current Protocols in Cytometry, Vol. 11, ed. J. P. Robinson (New York: John Wiley & Sons), 1–15.
Martin-Jézéquel, V., and Lopez, P. J. (2003). Silicon – a central metabolite for diatom growth and morphogenesis. Prog. Mol. Subcell. Biol. 33, 99–124. doi: 10.1007/978-3-642-55486-5_4
Martin-Jézéquel, V., Hildebrand, M., and Brzezinski, M. A. (2000). Silicon metabolism in diatoms: implications for growth. J. Phycology 36, 821–840. doi: 10.1104/pp.107.107094
Mason, N.W., de Bello, F., Mouillot, D., Pavoine, S., and Dray, S. (2013). A guide for using functional diversity indices to reveal changes in assembly processes along ecological gradients. J. Veg. Sci. 24, 794–806. doi: 10.1111/jvs.12013
Mayfield, M. M., and Levine, J. M. (2010). Opposing effects of competitive exclusion on the phylogenetic structure of communities. Ecol. Lett. 13, 1085–1093. doi: 10.1111/j.1461-0248.2010.01509.x
Macarthur, R., and Levins, R. (1967). Limiting similarity, convergence, and divergence of coexisting Species. Am. Nat. 101, 377–385. doi: 10.1086/282505
McGinty, N., Barton A. D., Record, N. R., Finkel, Z. V., and Irwin, A. J. (2018). Traits structure copepod niches in the North Atlantic and Southern Ocean. Mar. Ecol. Prog. Ser. 601, 109–126. doi: 10.3354/meps12660
MacKenzie, B. R., and Leggett, W. C. (1991). Quantifying the contribution of small-scale turbulence to the encounter rates between larval fish and their zooplankton prey: effects of wind and tide. Mar. Ecol. Prog. Ser. 73, 149–160. doi: 10.3354/meps213229
Mason, N. W. H., Mouillot, D., Lee, W. G., and Wilson, J. B. (2005). Functional richness, functional evenness and functional divergence: the primary components of functional diversity. Oikos 111, 112–118. doi: 10.1111/j.0030-1299.2005.13886.x
McLean, M. J., Mouillot, D., Goascoz, N., Schlaich, I., and Auber, A. (2019). Functional reorganization of marine fish nurseries under climate warming. Glob. Chang. Biol. 25, 660–674. doi: 10.1111/gcb.14501
Menden-Deuer, S., and Lessard, E. J. (2000). Carbon to volume relationships for dinoflagellates, diatoms, and other protist plankton. Limnol. Oceanogr. 45, 569–579. doi: 10.4319/lo.2000.45.3.0569
Ménesguen, A., Desmit, X., Dulière, V., Lacroix, G., Thouvenin, B., Thieu, V., and Dussauze, M. (2018). How to avoid eutrophication in coastal seas? A new approach to derive river-specific combined nitrate and phosphate maximum concentrations. Sci. Tot. Environ. 628, 400–414. doi: 10.1016/j.scitotenv.2018.02.025
Menezes, R. F., Borchsenius, F., Svenning, J. C., Davidson, T. A., Søndergaard, M., Lauridsen, T. L., Landkildehus, F., and Jeppesen, E. (2015). Homogenization of fish assemblages in different lake depth strata at local and regional scales. Fresh. Biol. 60, 745–757. doi: 10.1111/fwb.12526
Mitra, A., Castellani, C., Gentleman, W. C., Jónasdóttir, S. H., Flynn, K. J., Bode, A., et al. (2014). Bridging the gap between marine biogeochemical and fisheries sciences; configuring the zooplankton link. Prog. Oceanogr. 129, 176–199. doi: 10.1016/j.pocean.2014.04.025
Mondy, C. P., and Usseglio-Polatera, P. (2014). Using fuzzy-coded traits to elucidate the nonrandom role of anthropogenic stress in the functional homogenisation of invertebrate assemblages. Fresh. Biol. 59, 584–600. doi: 10.1111/fwb.12289
Morel, A., and Smith, R. C. (1974). Relation between total quanta and total energy for aquatic photosynthesis. Limnol. Oceanogr. 19, 591–600. doi: 10.4319/lo.1974.19.4.0591
Muscarella, R., and Uriarte, M. (2016). Do community-weighted mean functional traits reflect optimal strategies? Proc. Biol. Sci. 283:20152434. doi: 10.1098/rspb.2015.2434
Musielak, M. M., Karp-Boss, L., Jumars, P. A., and Fauci, L. J. (2009). Nutrient transport and acquisition by diatom chains in a moving fluid. J. Fluid Mech. 638, 401–421.
Naselli-Flores, L., Zohary, T., and Padisák, J. (2021). Life in suspension and its impact on phytoplankton morphology: an homage to Colin S. Reynolds. Hydrobiologia 848, 7–30. doi: 10.1007/s10750-020-04217-x
Nejstgaard, J. C., Tang, K., Steinke, M., Dutz, J., Koski, M., Antajan, E., and Long, J. (2007). Zooplankton grazing on Phaeocystis: a quantitative review and future challenges. Biogeochemistry 83, 147–172. doi: 10.1007/s10533-007-9098-y
Nelson, C. E., Danuta, M. B., and Bradley, J. C. (2013). Consistency and sensitivity of stream periphyton community structural and functional responses to nutrient enrichment. Ecol. Appl. 23, 159–173. doi: 10.1890/12-0295.1
Nissen, C., and Vogt, M. (2021). Factors controlling the competition between Phaeocystis and diatoms in the Southern Ocean and implications for carbon export fluxes. Biogeosciences 18, 251–283. doi: 10.5194/bg-18-251-2021
Oksanen, J., Blanchet, G. F., Kindt, R., and Legendre, P. (2011). Vegan: Community Ecology Package. Available online at: http://cran.r-project.org/web/packages/vegan/index.html
Olden, J. D., Poff, N. L., Douglas, M. R., Douglas, M. E., and Fausch, K. D. (2004). Ecological and evolutionary consequences of biotic homogenization. Trends Ecol. Evol. 19, 18–24. doi: 10.1016/j.tree.2003.09.010
Pan, Q., Tian, D., Naeem, S., Auerswald, K., Elser, J.J., Bai, Y., et al. (2016). Effects of functional diversity loss on ecosystem functions are influenced by compensation. Ecology 97: 2293-2302. doi: 10.1002/ecy.1460
Pančić, M., and Kiørboe, T. (2018). Phytoplankton defense mechanisms: traits and trade-offs. Biological Reviews 93: 1269–1303. doi: 10.1111/brv.12395
Pančić, M, Torres, R. R., and Almeda, R, Kiørboe, T. (2019). Silicified cell walls as a defensive trait in diatoms. Proc. Biol. Sci. 24:20190184. doi: 10.1098/rspb.2019.0184
Plankton Ciliate Project (2002). Plankton Ciliate Project. University of Liverpool. Available online at: http://www.liv.ac.uk/ciliate/intro.htm
Podani, J. (1999). Extending Gower’s general coefficient of similarity to ordinal characters. Taxon 48, 331–340. doi: 10.2307/1224438
Pohlert, T. (2014). The Pairwise Multiple Comparison of Mean Ranks Package (PMCMR). R package. Available online at: http://CRAN.R-project.org/package=PMCMR
Proulx, M. and Mazumder, A. (1998), Reversal of grazing impact on plant species richness in nutrient-poor vs. nutrient-rich ecosystems. Ecology 79, 2581–2592.
Putt, M., and Stoecker, D. K. (1989). An experimentally determined carbon: volume ratio for marine “oligotrichous” ciliates from estuarine and coastal waters. Limnol. Oceanogr., 34, 1097–1103. doi: 10.4319/lo.1989.34.6.1097
R version 3.5.3 (2019). “Great Truth”, the R Foundation for Statistical Computing Platform: i386-w64-mingw32/i386 (32-bit). Vienna: R Foundation for Statistical Computing.
Richirt, J., Goberville, E., Ruiz-Gonzalez, V., and Sautour, B. (2019). Local changes in copepod composition and diversity in two coastal systems of Western Europe, Estuar. Coast. Mar. Sci. 227:106304. doi: 10.1016/j.ecss.2019.106304
Riley, G. A. (1957). Phytoplankton of the north central Sargasso Sea. Limnol. Oceanogr. 2, 252–270. doi: 10.1002/lno.1957.2.3.0252
Robert P., and Escoufier Y. (1976). A unifying tool for linear multivariate statistical methods: the RV-coefficient. J. Appl. Stat., 25, 257–265.
Rogalski, M. A., Skelly, D. K., and Leavitt, P. R. (2017). Daphniid zooplankton assemblage shifts in response to eutrophication and metal contamination during the Anthropocene. P. Roy. Soc. B Biol. Sci., 284:20170865. doi: 10.1098/rspb.2017.0865
Rose, M. (1933). Copépodes pélagiques. – Faune de France, Vol. 26, ed. P. Lechevalier (Paris), 374. Available online at: https://faunedefrance.org/bibliotheque/docs/M.ROSE(FdeFr26)Copepodes-pelagiques.pdf
Rousseau, V., Mathot, S., and Lancelot, C. (1990). Calculating carbon biomass of Phaeocystis sp. from microscopic observations. Mar. Biol. 107, 305–314. doi : 10.1007/BF01319830
Rousseau, V., Chrétiennot-Dinet, M. J., Jacobsen, A., Verity, P., and Whipple, S. (2007). The life cycle of Phaeocystis: state of knowledge and presumptive role in ecology. Biogeochemistry 83, 29–47. doi: 10.1007/s10533-007-9085-3
Schapira, M., Vincent, D., Gentilhomme, V., and Seuront, L. (2008). Temporal patterns of phytoplankton assemblages, size spectra and diversity during the wane of a Phaeocystis globosa spring bloom in hydrologically contrasted coastal waters. J. Mar. Biol. Assoc. U. K. 88, 649–662. doi: 10.1017/S0025315408001306
SchillerSchiller, J. (1931–1937). “Dinoflagellatae (Peridinineae) in monographischer Behandlung,” in Kryptogamen-Flora von Deutschland, Österreichs und der Schweiz. Akad, (Vol. 10 (3): Teil 1 (1–3) (1931–1933): Teil 2 (1–4) (1935–1937)) ed L. Rabenhorst (Leipzig: Verlag).
Schoemann, V., Becquevort, S., Stefels, J., Rousseau, V., and Lancelot, C. (2005). Phaeocystis blooms in the global ocean and their controlling mechanisms: a review. J. Sea Res. 53, 43–66. doi: 10.1016/j.seares.2004.01.008
Schwaderer, A. S., Yoshiyama, K., De Tezanos Pinto, P., Swenson, N. G., Klausmeier, C. A., and Litchman, E. (2011). Eco-evolutionary differences in light utilization traits and distributions of freshwater phytoplankton. Limnol. Oceanogr. 56, 589–598. doi: 10.4319/lo.2011.56.2.0589
Seuront, L., Lacheze, C., Doubell, M. J., Seymour, J. R., Van DongenVogels, V., Newton, K., Alderkamp, A. C., and Mitchell, J. G. (2007). The influence of Phaeocystis globosa on microscale spatial patterns of chlorphyll a and bulk-phase seawater viscosity. Biogeochemistry 83, 173–188.
Shipley, B. (2010). From Plant Traits to Vegetation Structure: Chance and Selection in the Assembly of Ecological Communities. Cambridge: Cambridge University Press.
Silverman, B. W. (1986). Density Estimation for Statistics and Data Analysis. London: Chapman and Hall.
Smetacek, V. (1999). Diatoms and the ocean carbon cycle. Protist 150, 25–32. doi: 10.1016/S1434-4610(99)70006-4
Smith, V. H., and Schindler, D. W. (2009). Eutrophication science: where do we go from here? Trends Ecol. Evol. 24, 201–207. doi: 10.1016/j.tree.2008.11.009
Stawiarski, B. (2014). The Physiological Response of Picophytoplankton to Light, Temperature and Nutrients Including Climate Change Model Simulations. Ph.D. thesis. Norwich: Universityof East Anglia
Steinberg, D. K., and Landry, M. R. (2017). Zooplankton and the ocean carbon cycle. Annu. Rev. Mar. Sci. 9, 413–444. doi: 10.1146/annurev-marine-010814-015924
Stelfox-Widdicombe, C. E., Edwards, E. S., Burkill, P. H., and Sleigh, M. A. (2000). Microzooplankton grazing activity in the temperate and sub-tropical NE Atlantic: summer 1996. Mar. Ecol. Prog. Ser. 208, 10–12.
Takabayashi, M., Lew, K., Johnson, A., Marchi, A., Dugdale, R., and Wilkerson, F. P. (2006). The effect of nutrient availability and temperature on chain length of the diatom Skeletonema costatum. J. Plankton Res. 28, 831–840.
Taylor, B. W., Keep, C. F., Hall, R. O. Jr., Koch, B. J., Tronstad, L. M., Flecker, A., et al. (2007). Improving the fluorometric ammonium method: matrix effects, background fluorescence, and standard additions. J. N. Am. Benthol. Soc. 26, 167–177. doi: 10.1899/0887-3593200726
Thackeray, S. J., and Jones, I. D. and Maberly, S. C. (2008). Long-term change in the phenology of spring phytoplankton: species-specific responses to nutrient enrichment and climatic change. J. Ecol. 96, 523–535. doi: 10.1111/j.1365-2745.2008.01355.x
Thieu, V., Billen, G., and Garnier, J. (2009). Nutrient transfer in three contrasting NW European watersheds: the seine, somme, and scheldt rivers. A comparative application of the Seneque/Riverstrahler model. Water Res. 43, 1740–1748.
Tréguer, P., and Pondaven, P. (2000). Global change: silica control of carbon dioxide. Nature 406, 358–359. doi: 10.1038/35019236
Van den Hoek, C., and Mann, D. G. and Jahns, H. M. (1995). Algae: An Introduction to Phycology. Cambridge, MA: Cambridge University Press.
van Rijssel, M., Hamm, C., and Gieskes, W. (1997). Phaeocystis globosa(Prymnesiophyceae) colonies: hollow structures built with small amounts of polysaccharides. Eur. J. Phycol. 32, 185–192. doi: 10.1080/09670269710001737119
Villéger S., Mason N. W. H., and Mouillot, D. (2008). New multidimensional functional diversity indices for a multifaceted framework in functional ecology. Ecology 89, 2290–2301. doi: 10.1890/07-1206.1
Villéger, S., Grenouillet, G., and Brosse, S. (2014). Functional homogenization exceeds taxonomic homogenization among European fish assemblages. Global Ecol. Biogeogr. 23, 1450–1460. doi: 10.1111/geb.12226
Violle, C., Navas, M. L., Vile, D., Kazakou, E., Fortunel, C., and Hummel, I. et al. (2007). Let the concept of trait be functional! Oikos 116, 882–892. doi: 10.1111/j.0030-1299.2007.15559.x
Virta, L., Gammal, J., Järnström, M., Bernard, G., Soininen, J., Norkko, J., et al. (2019). The diversity of benthic diatoms affects ecosystem productivity in heterogeneous coastal environments. Ecology 100:e02765. doi: 10.1002/ecy.2765
Vitousek, P. M., Mooney, H. A., and Lubchenco, J. (1997). Human domination of Earth’s ecosystems. Science 277, 494–499. doi: 10.1126/science.277.5325.494
Wengrat, S., Padial, A. A., Jeppesen, E., Davidson, T. A., Fontana, L., Costa-Boddeker, S., and Bicudo, D. C. (2018). Paleolimnological records reveal biotic homogenization driven by eutrophication in tropical reservoirs. J. Paleolimnol. 60, 299–309.
White, E. P., Ernest, S. K. M., Adler, P. B., Hurlbert, A. H., and Lyons, S. K. (2010). Integrating spatial and temporal approaches to understanding species richness. Phil. Trans. R. Soc. B 365, 3633–3643. doi: 10.1098/rstb.2010.0280
Wickham, H. (2016). ggplot2: Elegant Graphics for Data Analysis. New York, NY: Springer-Verlag New York.
Wiebe, P. H. (1988). Functional regression equations for zooplankton displacement volume, wet weight, dry weight, and carbon: a correction. Fish. Bull. 86, 833–835.
Williams, R., and Robins, D. B. (1982). Effects of preservation on wet weight, dry weight, nitrogen and carbon contents of Calanus helgolandicus (Crustacea: copepoda). Mar. Biol. 71, 271–281.
Worm, B., Lotze, H., and Hillebrand, H. (2002). Consumer versus resource control of species diversity and ecosystem functioning. Nature 417, 848–851. doi: 10.1038/nature00830
Zakaria, H. Y., Hassan, A. M., El-Naggar, H. A., and Abo-Senna, F. M. (2018). Biomass determination based on the individual volume of the dominant copepod species in the Western Egyptian Mediterranean Coast. Egyptian J. Aquatic Res. 44, 89–99. doi: 10.1016/j.ejar.2018.05.002
Zhang, Y., Cheng, L., Li, K., Zhang, L., Cai, Y., Wang, X., et al. (2019). Nutrient enrichment homogenizes taxonomic and functional diversity of benthic macroinvertebrate assemblages in shallow lakes. Limnol. Oceanogr. 64, 1047–1058. doi: 10.1002/lno.11096
Keywords: diatoms, copepods, Phaeocystis, biodiversity, functional traits, seasonality, trade-off
Citation: Breton E, Christaki U, Sautour B, Demonio O, Skouroliakou D-I, Beaugrand G, Seuront L, Kléparski L, Poquet A, Nowaczyk A, Crouvoisier M, Ferreira S, Pecqueur D, Salmeron C, Brylinski J-M, Lheureux A and Goberville E (2021) Seasonal Variations in the Biodiversity, Ecological Strategy, and Specialization of Diatoms and Copepods in a Coastal System With Phaeocystis Blooms: The Key Role of Trait Trade-Offs. Front. Mar. Sci. 8:656300. doi: 10.3389/fmars.2021.656300
Received: 20 January 2021; Accepted: 30 July 2021;
Published: 06 September 2021.
Edited by:
Maria Moustaka-Gouni, Aristotle University of Thessaloniki, GreeceReviewed by:
Jun Sun, China University of Geosciences, ChinaFabio Benedetti, ETH Zürich, Switzerland
Benjamin Alric, Centre National de la Recherche Scientifique (CNRS), France
Copyright © 2021 Breton, Christaki, Sautour, Demonio, Skouroliakou, Beaugrand, Seuront, Kléparski, Poquet, Nowaczyk, Crouvoisier, Ferreira, Pecqueur, Salmeron, Brylinski, Lheureux and Goberville. This is an open-access article distributed under the terms of the Creative Commons Attribution License (CC BY). The use, distribution or reproduction in other forums is permitted, provided the original author(s) and the copyright owner(s) are credited and that the original publication in this journal is cited, in accordance with accepted academic practice. No use, distribution or reproduction is permitted which does not comply with these terms.
*Correspondence: Elsa Breton, elsa.breton@univ-littoral.fr